
Risques climatiques : six Français sur dix sont d’ores et déjà concernés
Selon le groupe d’experts intergouvernemental sur l’évolution du climat (GIEC), certains événements extrêmes météorologiques peuvent dorénavant devenir plus fréquents, plus répandus ou plus intenses. La France est exposée à de multiples aléas climatiques à l’origine de 165 évènements naturels dommageables entre 1900 et 2017 et de 3 100 victimes (hors vagues de chaleur). Comment estimer l’exposition de la population française à ces risques climatiques ? Comment approcher la vulnérabilité des territoires qui dépend également de l’exposition des différents pans de l’économie locale ?
According to the Intergovernmental Panel on Climate Change (IPCC), certain extreme weather events can now become more frequent, more widespread, or more intense. France is exposed to multiple climate hazards responsible for 165 damaging natural events between 1900 and 2017 and 3,100 deaths (excluding heat waves). How can we estimate the exposure of the French population to these climate risks? How can we approach the vulnerability of territories, which also depends on the exposure of different sectors of the local economy?
5 chapters
- What is climate risk?Hazards and stakesPopulations, assets, and human activities in territories (stakes) are subject to numerous climate hazards (flooding or marine submersion, storm or cyclone, ground movements, coastal erosion, wildfire, avalanche) that generate climate risks to property and people. These are major risks characterized by low frequency and high severity, causing numerous casualties and/or significant material damage and environmental impacts.VulnerabilityVulnerability measures the level of foreseeable consequences of a hazard on the stakes. It characterizes the greater or lesser resistance of the stakes in a given territory to a given event.
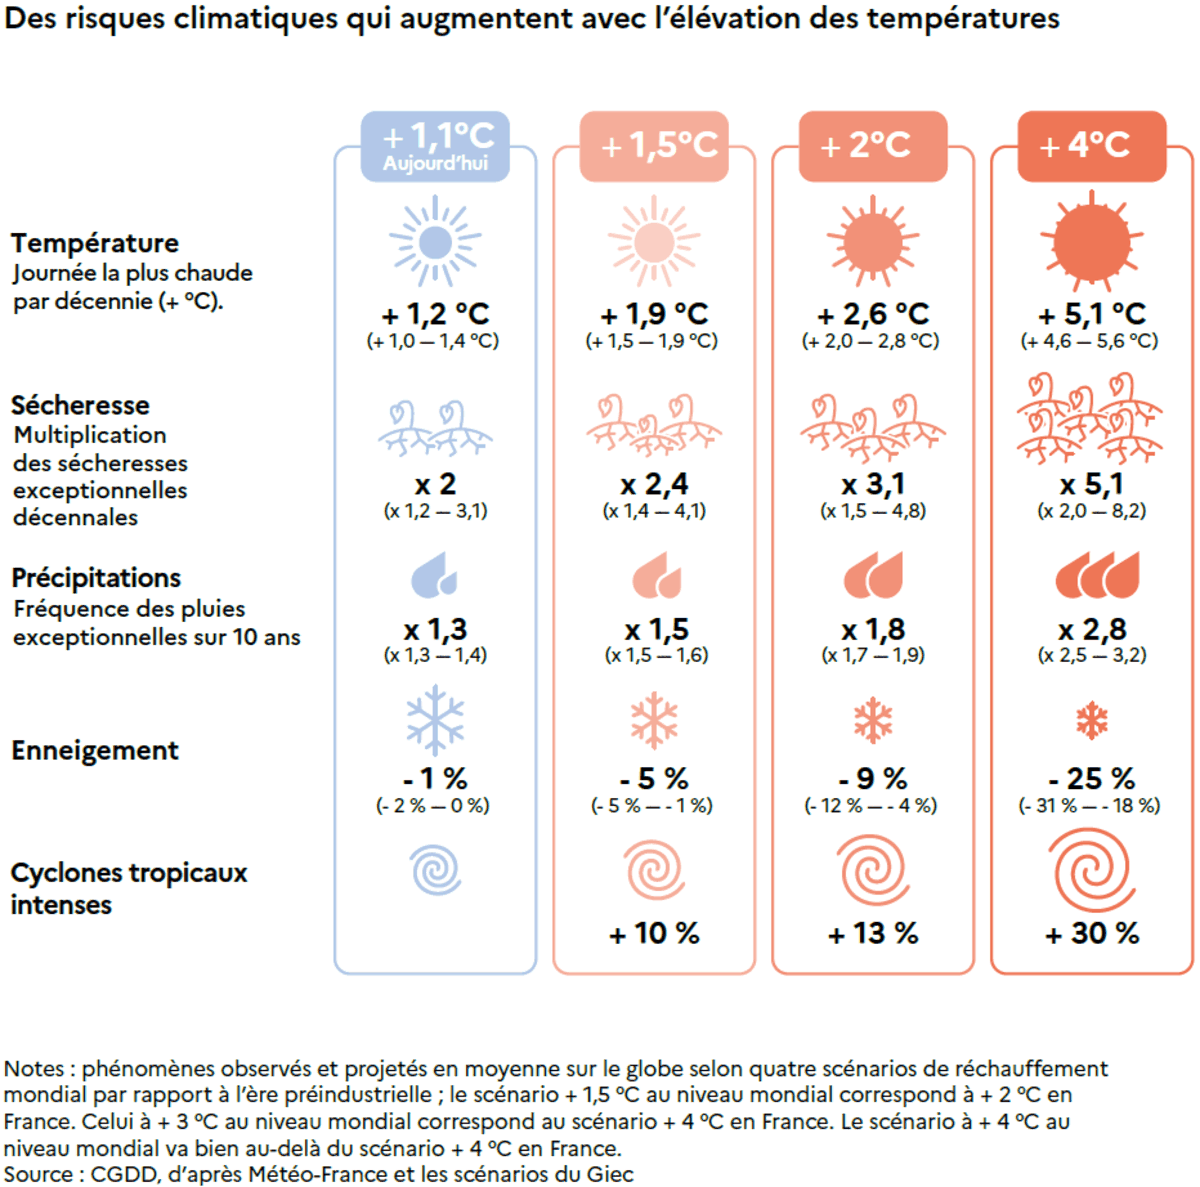
- How does climate change impact the level of climate risk?Climate change environmental driversAccording to the IPCC, "beyond rising temperatures, the impacts of climate change result from multiple environmental drivers. Among these are changes in rainfall patterns, sea-level rise, and extreme phenomena such as floods, droughts, and heat waves" (IPCC, 2014e).Nature and severity of impactsAs for the nature and severity of impacts, "they depend not only on the characteristics of hazards, such as changes in climate averages and extremes, but also on vulnerability, or the sensitivity and adaptive capacity of populations, as well as their exposure to climate threats" (IPCC SR1.5, 2018).
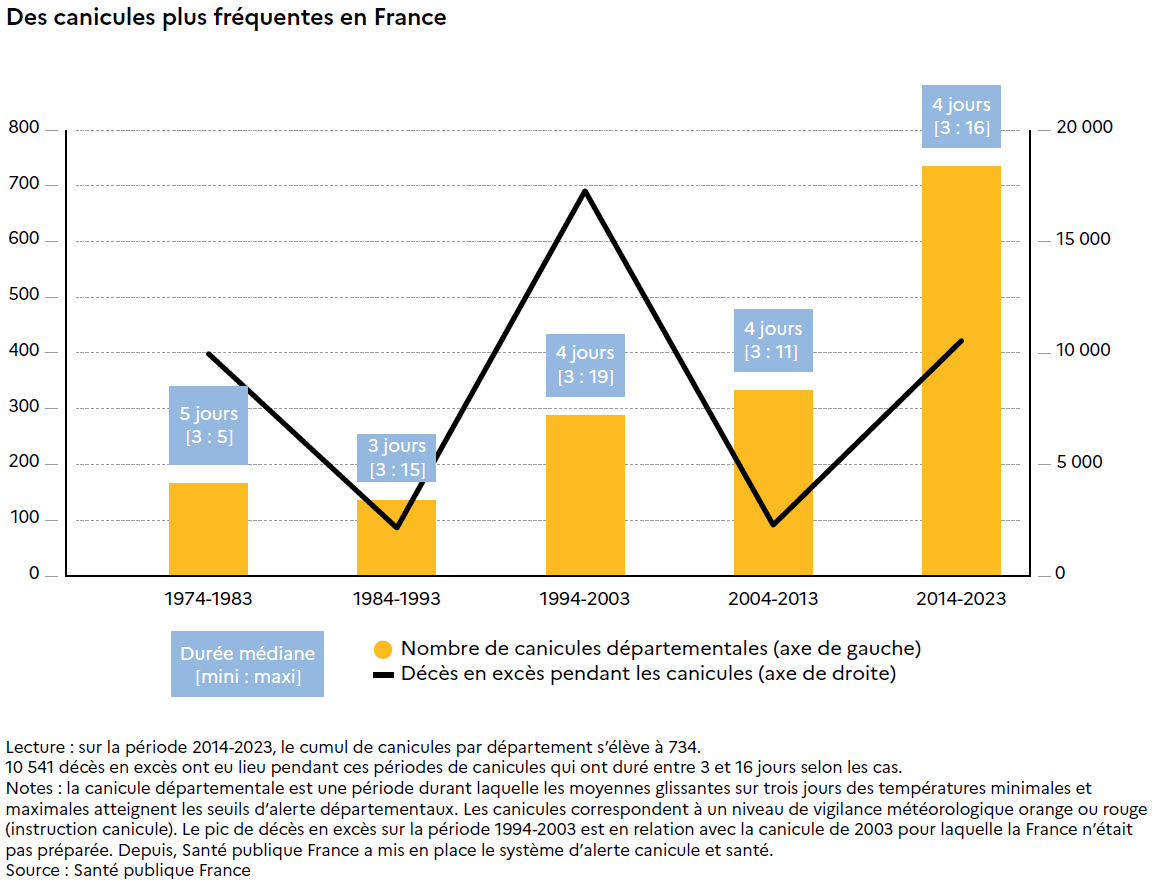
- France is exposed to multiple climate hazardsClimate and geomorphological diversityThe extreme diversity of France's climate and geomorphological characteristics underpins its territorial exposure: Atlantic regime subject to marine submersion (coastal areas), clay soils prone to clay shrinkage-swelling (South-West, Centre), tropical cyclones (Caribbean), etc.Balance of events 1900–2017Between 1900 and 2017, 180 damaging natural events affected France. Nine in ten events are linked to climate conditions. About two-thirds of climate phenomena correspond to flooding and one-fifth to atmospheric phenomena (cyclone, hurricane, storm). Nevertheless, most casualties (85%) result from heat waves. The heatwave during summer 2003 was particularly devastating in mainland France (15,000 deaths).Very serious eventsAmong all damaging natural events (including seismic events), more than two-thirds are deemed "very serious" because they caused at least 10 deaths or over 30 million euros in material damage. The annual frequency of these "very serious" events has nearly quadrupled over the past two decades compared to the four previous decades. It rose from one event per year between 1950 and 1996, to 3.6 over the period 1997 to 2017.
- Flooding and ground movements: one in two municipalities exposedHazard prevalence by municipalityIn 2016, at least one climate-type natural hazard was identified by state services for four-fifths of French municipalities (28,500 municipalities). Individual analysis of hazards shows the prevalence of flooding and ground movements. They affect respectively 57% and 53% of municipalities. Followed by atmospheric phenomena (21%), wildfires (19%), and finally avalanches (2%). Moreover, many municipalities face multiple hazards simultaneously: two (30%), three (14%), four (4%), or even five (0.2%).Territorial exposure levelsThe exposure level of populations within these municipalities declared at risk or at multi-hazard climate risk reflects territorial disparities. These result not only from the conjunction of various climate hazards in the same territory, but also from the degree of urbanization. Municipalities can be classified according to five exposure levels: very high (5% of municipalities), high (13%), moderate (11%), low (19%), very low (32%), or none (20%). This exposure is stronger when population density and the number of identified climate risks per municipality are high.Hazard maps by municipality• Number of climate hazards identified by municipality in 2016 • Number of climate hazards identified by municipality in 2018Methodology> Methodology: exposure index Populations potentially exposed to climate risks (flooding or marine submersion, storms or cyclones, ground movements, wildfires, avalanches) is analyzed at municipal level in mainland France and overseas. The method relies on declarations by municipalities at major risk from state services. These are adjusted to account for proven risks when municipalities have been subject to at least three natural disaster decrees for a given climate hazard between 1982 and 2015. Exposure = score for number of climate hazards x score for population density/10 = (number of declared hazards/number of possible hazards x 10) x (population density quantile/10) / 10 Each score ranges from 0 (no hazard; lowest population density) to 10 (all hazards; highest population density). Exposure ranges from 0 (lowest exposure) to 10 (highest exposure). Exposure was divided into 6 classes (Jenks natural breaks) for mapping: no climate risk (0), very low (0 to 1.6), low (1.6 to 2.8), moderate (2.8 to 4.0), high (4.0 to 5.6), very high (5.6 to 9.8). See: CGDD/SDES, 2020. Note de méthode. La vulnérabilité des communes aux menaces climatiques: méthode de calcul et classification typologique, January 2020, 32 p.
- From exposed population to territorial vulnerabilitySix territory categoriesThe 28,657 municipalities exposed to climate-type natural risks can be classified into six homogeneous territory categories in terms of exposure to climate risks. The extent of risks in these territories depends on development and planning choices made, particularly at local level, considering the vulnerability of these zones and the stakes involved (population, industry, commerce, heritage, etc.).Flood-vulnerable territoriesTwo-thirds of the French population (44 million inhabitants) living in nearly half the municipalities are vulnerable to flooding. 61% of them are also exposed to ground movements. They are located along the five major metropolitan rivers and tributaries, on the Atlantic coast, and in French Guiana. These territories concentrate on average more inhabitants and urbanized areas (respectively 1.3 times more), educational or health facilities (1.4 times more), sports facilities or individual houses (1.2 times more).Rural areas and ground movementsAbout 6% of the population and 16% of French municipalities are located in rural areas exposed to ground movements. A quarter of these municipalities are also affected by wildfires. Two times less urbanized than average, these territories also have 2.6 times less population.South-East forest massifsThe third group includes 13 million inhabitants (18% of the population) and 14% of French municipalities, mainly located in large South-East forest massifs. With four times more shrubland and/or herbaceous vegetation and twice as much forest compared to the French average, they are particularly vulnerable to wildfires. Higher buildings, population, and employer establishments in flood-prone zones than average increase their vulnerability to flooding.Mountain municipalities and avalanchesAvalanches affect 611 high-mountain municipalities (2% of municipalities). Over 90% of them are also exposed to flooding or ground movements, and three-quarters to wildfires. Located three-quarters in rural areas and very far from services (Alps, Pyrenees), these municipalities are focused on tourism: 6.7 times more second homes and 2.7 times more tourist facilities than the metropolitan average.Overseas departmentsOverseas departments (excluding French Guiana) are affected by hurricanes across their entire territory, by ground movements and flooding, and to a lesser extent by wildfires. This group represents less than 3% of the population, but has seven times more urbanized areas and ten times more inhabitants and houses than the national average. Marine submersion threatens coastlines. The footprint of buildings, total or single-story, and population living in these potentially flood-prone zones are respectively 14, 17, and 20 times the French averages.Low-vulnerability territoriesLow-vulnerability territories housing nearly 3.6 million inhabitants living in one-fifth of French municipalities. Located in rural areas with declining population, these municipalities also have about four times fewer inhabitants on average, and the number of houses and urbanized areas are 2.5 times smaller.Methodology> Methodology: vulnerability typology The vulnerability typology of territories and exposed stakes makes it possible to estimate the cumulative effects of climate risks likely to affect a particular municipality and to approach the resilience capacity of territories when a disaster occurs. Each municipality is assigned five boolean variables (0/1) according to whether its territory is affected or not by the following climate hazards: flooding, ground movement, wildfire, atmospheric phenomenon, and avalanche. The atmospheric phenomenon risk is considered only for overseas municipalities. It is considered null for mainland France. Statistical analysis (hierarchical ascending classification) of these variables distributes French municipalities among 5 classes. For each, the average number of risks was calculated to characterize these classes with regard to risk exposure, as well as the percentages of underrepresentation or overrepresentation of a climate risk in a class compared to all municipalities. Classes are then characterized with regard to qualitative variables (typologies of urban areas, land use, etc.) and quantitative variables (number of main residences, facilities, jobs, dwellings and inhabitants in flood-prone zones, etc.). A comparative statistical mean analysis thus verifies whether, for each initial variable, the mean in a class is significantly different from the mean across the entire population. See: CGDD/SDES, 2020. Note de méthode. La vulnérabilité des communes aux menaces climatiques: méthode de calcul et classification typologique, January 2020, 32 p.