Transport et déplacements du quotidien : quels effets sur l’environnement ?
Chaque jour, plusieurs dizaines de millions de personnes se déplacent en France pour aller travailler, faire leurs courses, accompagner leurs enfants ou se rendre à des activités de loisir. Ces déplacements font partie du quotidien et ont aussi un impact sur l’environnement. Les transports sont ainsi le premier secteur émetteur de gaz à effet de serre en France. Découvrez comment les Français se déplacent, quels sont les effets de ces déplacements sur l’environnement, et comment les pratiques évoluent.
Every day, tens of millions of people travel in France to go to work, do their shopping, take their children to activities or enjoy leisure. These trips are part of daily life and also impact the environment. Transport is thus France's leading greenhouse gas-emitting sector. Discover how French people travel, what effects these trips have on the environment, and how practices are evolving.
- How do French people travel today?Cars dominant mode• In France, the car is the most widely used mode of transport for daily travel and long distances. • In 2023, 82% of all distances traveled by people were by car. For comparison, trains account for 11%, buses, coaches and trams 5%, and planes 1% (source: SDES).Walking and cycling: short trips• Walking or cycling is less frequent than car travel, but these practices play an important role, especially for short journeys. • Nearly a quarter of local trips are made on foot (23.9%), and 2.6% by bike (source: SDES). • These habits vary by person and region: • women walk more than men: walking accounts for 25.8% of their trips versus 22% for men; • men use bikes twice as much as women: this mode of transport represents 3.7% of their trips versus 1.5% for women; • cycling is more common in cities where bike lanes and facilities are well developed.
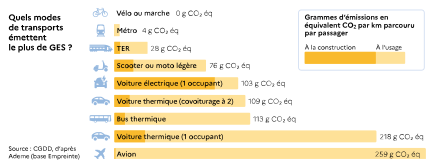
- Environmental impact of each transport modeEmission factors• Not all modes of transport have the same environmental effects. This depends on several factors: distance traveled, type of energy used, number of passengers transported, and materials needed for their construction. • Which transport modes emit the most greenhouse gas?Walking and cycling: very low emissions• Walking produces no greenhouse gas emissions. It is a simple means of transport, accessible to almost everyone, and beneficial for health. It is well suited to short trips, which represent a large share of daily travel. • Cycling also has very limited environmental impact. Most emissions related to cycling come from its manufacture, but they remain low. E-bikes emit slightly more due to their battery and materials used, but remain much more efficient than cars. • Walking and cycling thus allow travel with very little emissions. Their development depends largely on infrastructure like bike lanes, safe sidewalks and bike parking.Public transport: reduced emissions per passenger• Public transport such as trains, trams, metros and buses generally emit much less greenhouse gas than cars, per person transported. • This is explained by two main reasons: • they can carry a large number of passengers at once; • they often run on electricity, which limits greenhouse gas emissions. In France, this electricity is produced largely from sources that release little CO2, such as nuclear, wind, solar and hydroelectric dams. This is called a "low-carbon electricity mix." • The train is one of the most fuel-efficient motorized means of transport. Buses and coaches have more variable impacts: they remain advantageous when carrying many passengers, but can be more polluting if half-empty or running on diesel or petrol engines, especially if old.Thermal and electric cars: different impacts• The thermal car (petrol or diesel) is the most widespread mode of transport. It is also one of the most polluting, notably because it is often used alone. On average, a car carries 1.4 people per trip (source: SDES). • But different engines don't have the same environmental impact: • petrol or diesel cars emit heavily during use: on average, a 10 km trip by "thermal" car generates about 2.2 kg of CO2 per person when used alone (source: Ademe, Empreinte Base, 2024). This makes it one of the most polluting modes of transport, especially for short or little-shared trips; • electric cars emit little during use but more during manufacture: unlike diesel or petrol cars, electric cars emit little CO2 during use. However, their manufacture, particularly the battery, is more resource-intensive. For example, it requires about 207 kg of so-called "critical metals" (such as lithium, cobalt or nickel), versus 34 kg for a thermal car (source: International Energy Agency). The production of these materials and vehicle manufacture thus cause more initial emissions, but these are then "offset" over the kilometers traveled. • According to ADEME, an electric car can become less polluting than a thermal car from 20,000 km traveled, but this threshold can reach 70,000 km or even over 100,000 km depending on vehicle size and battery capacity. Furthermore, an electric car emits little fine particulate matter, unlike thermal cars.Planes: high impact for small share of tripsIn France, air trips represent a very small part of daily travel. However, their environmental impact is high. Thus, a flight has a higher impact than a car trip over an equivalent distance. This is explained by the amount of fuel burned at takeoff, but also by altitude-specific effects such as contrails. These effects amplify climate change beyond CO2 emissions alone.
- Why car remains the primary transport modeOverwhelmingly dominant useIn 2023, 83% of French households owned at least one car (source: INSEE). The car remains the most widely used mode of transport. Several reasons explain this situation:Distances and transport supply• distances to travel are often significant: for example, a home-work trip averages 14.2 km. This makes walking or cycling difficult, especially outside cities (source: SDES); • public transport is not available everywhere: outside major cities, supply is often less developed, with few buses or trains.Land use planning• areas on the outskirts of cities are more car-dependent: in these territories, emissions from home-work trips are twice as high as in urban centers, due to longer distances and lack of alternatives (source: SDES); • land use planning has strengthened this dependency: urbanization often took place on city outskirts, with housing, shops or activity zones far apart from each other, making cars difficult to replace.
- Multiple effects on environment and healthHarmful pollutants health risk• Transport also contributes to air pollution, noise, dispersal of certain metals in the environment, and consumption of natural resources. Some of these impacts have direct consequences on human health, disrupt habitats for animals and plants, or harm quality of life. • In addition to CO2, cars, trucks, vans and buses emit other substances that pollute the air. These pollutants are emitted mainly by exhaust gases, but also by brake wear, tire wear and road wear. • The two most monitored pollutants are: • nitrogen oxides (NOx): they are produced by engines. Road transport accounts for 47% of national NOx emissions. These gases can irritate the respiratory tract and worsen chronic diseases like asthma or bronchitis. • fine particles (PM10 and PM2.5): they are partly emitted at exhaust, but also released by braking or tire wear. Transport is responsible for 10% of fine particle emissions smaller than 2.5 micrometers (PM2.5) in France (source: Citepa). • According to Public Health France, 40,000 deaths could be prevented each year in France by reducing exposure to fine particles.Other transport pollution forms• Transport doesn't only pollute the air. It is also responsible for other types of nuisances: • noise, especially in dense urban areas or along major roads; • dispersal of metals in the environment, such as copper or zinc, from braking or vehicle corrosion. • These pollutions affect natural habitats, soils, water quality, but also residents' quality of life, particularly in neighborhoods near major traffic routes. According to the World Health Organization, noise is thus the second leading cause of health problems related to the environment in Europe, behind air pollution.Effects on soils and natural resources• Transport also has indirect, less visible impacts on the environment: • soil artificialization: to build roads, parking lots or railways, natural, agricultural or forest soils must be transformed into artificial surfaces. This transformation reduces soils' ability to absorb rainwater and can contribute to biodiversity loss; • habitat fragmentation: traffic routes are barriers for certain species that can no longer reach their feeding or breeding areas. Meanwhile, many animals are hit by vehicles each year; • use of natural resources: the entire transport sector consumes many natural resources: metals, concrete, fuels, etc. These resources are extracted, processed, transported, which causes impacts at a global scale, far beyond vehicle use alone.
- Evolving travel practicesCar fleet changing rapidly• Travel habits are changing gradually, driven by public policies, technological innovations and individual choices. Recent trends show changes in car, bicycle and public transport use. • In 2023, electric and rechargeable hybrid cars represented 26.2% of new car registrations, versus 2.9% in 2019. Conversely, diesel cars now represent less than 10% of sales, whereas they exceeded 70% in the early 2010s (source: SDES). • Several reasons explain this change: • electric cars emit little greenhouse gas and fine particles during use, which attracts certain buyers, especially for frequent or urban use; • government aid supports this purchase, such as the ecological bonus or conversion incentive; • in some cities, regulations limit access for the most polluting cars.Rising bike use still limitedCycling is still underused, but its practice is increasing. In 2023, 4% of working people reported cycling to work, double the rate in 2015 (source: SDES). This growth remains mainly concentrated in cities and depends heavily on the quality of cycling infrastructure (bike lanes, parking, etc.).Public transport: minority use but growingWhile domestic passenger transport is still largely dominated by private vehicles representing 82%, the share of rail transport is 11% and that of collective road transport is 5%. Air transport represents just over 1% of domestic passenger transport.
- Transport access inequalitiesIncome and profile disparities• Access to different transport modes depends heavily on personal situation, place of residence and income level. These inequalities influence how each person can travel and the environmental impact of these trips. • Mobility choices are not the same for everyone. They vary by income, age or place of residence. • Lower-income households often drive older vehicles or diesel-powered ones (source: SDES), cheaper to buy but often more polluting. In 2022, electric cars represented 11.1% of new car purchases among lower-income households, versus 25.5% among higher-income ones (source: SDES). • Age also plays a role: 25-40 year-olds are more likely to choose an electric vehicle (27.1% of their purchases) than those over 65 (9.5%). • Home equipment is another factor: installing a charging station is easier in a house than in an apartment building.Differences by place of residence• Living in a large city generally provides better access to public transport or bike lanes. Conversely, in rural or suburban areas, residents often depend on their car for travel. • Home-work trip emissions are 40% lower in municipalities where most of the population can walk to a metro or tram station (source: SDES). This is notably explained by more frequent public transport use in these areas.
Further reading
- Les Français et le vélo en 2022notre-environnement.gouv.fr
Pour se balader occasionnellement ou se déplacer quotidiennement, les ménages français ont fait l’acquisition de plus de 10 millions de bicyclettes au cours des cinq dernières années.
- Les émissions de gaz à effet de serre du secteur des transportsnotre-environnement.gouv.fr
Détail des émissions de gaz à effet de serre du secteur des transports en France et de leur évolution, selon le mode de transport (voitures, poids lourds, aérien…)
- Repenser les déplacements pour préserver les ressources naturellesnotre-environnement.gouv.fr
La voiture reste essentielle pour de nombreux Français, mais elle a un impact sur l’environnement. L’industrie automobile cherche des solutions pour une mobilité plus durable.
- Quel est l’impact sur l’environnement de la circulation des voitures ?notre-environnement.gouv.fr
39 millions de voitures en circulation, 66 millions de tonnes d’émissions de CO2, 8 % des particules fines, etc. : quel est l’impact des voitures sur l’environnement en France ?
- Chiffres clés des transports édition 2025statistiques.developpement-durable.gouv.fr
Publication du CGDD, Service des données et études statistiques, Coll. Datalab, mars 2025
- Acquérir une voiture électrique : pas seulement une question de revenusstatistiques.developpement-durable.gouv.fr
Publication du CGDD, Service des données et études statistiques, Coll. Datalab essentiel, février 2025