Évolution de la qualité bactériologique des produits de la mer (coquillages)
L’évolution générale de la qualité montre un état microbiologique des coquillages dans les zones de production satisfaisant.
Overall quality trends indicate satisfactory microbiological conditions for shellfish in production zones.
1 chapter
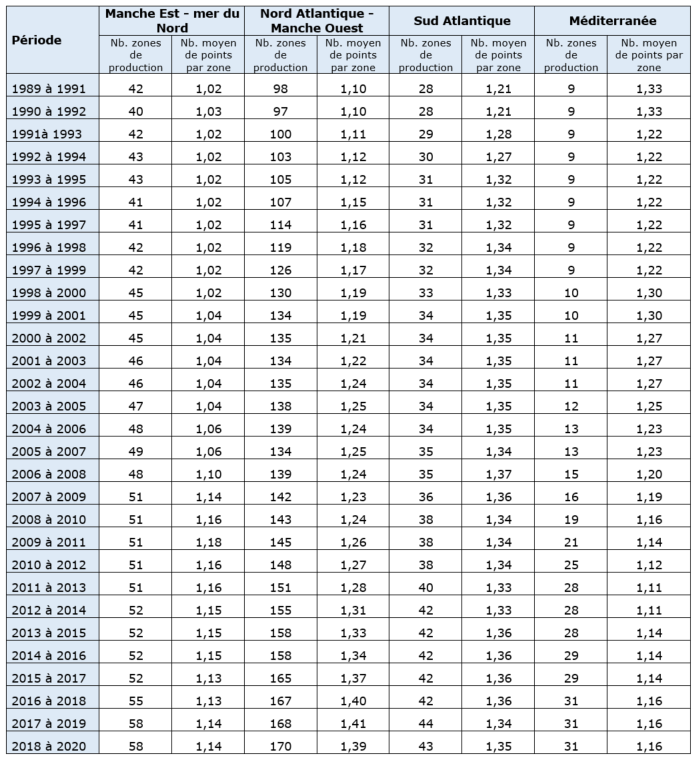
- Key Figures 2020Key Figures397 shellfish bacteriological quality monitoring points: 26% good quality and 66% average qualityGeneral Analysis• Coastal environments face multiple contamination sources from human and animal origins: urban wastewater, rainfall runoff from agricultural areas, and wildlife. By filtering water, shellfish concentrate the microorganisms it contains. Consequently, the presence of potentially pathogenic bacteria or viruses in water (Salmonella, Vibrio spp., norovirus, hepatitis A virus) can pose health risks when consuming shellfish (gastroenteritis, viral hepatitis). • In 2020, the Shellfish Production Zone Microbiological Monitoring Network (REMI) relied on 397 monitoring points distributed across 302 shellfish production zones. Microbiological quality was rated good quality (A) for 26% of points, average quality (B) for 66% of points, poor quality (C) for 6% of points, and very poor quality (D) for 2% of points. • Since 1991, the number of monitoring points has doubled, rising from 197 during 1989–1991 to 397 in 2018–2020. Across the entire coastline, the North Atlantic–West English Channel coast has consistently had the highest number of monitoring points. • Overall quality trends indicate satisfactory microbiological conditions for shellfish in production zones. The proportion of monitoring points in good and average quality exceeds 90% for 22 of the 30 periods considered (1991 to 2020).REMI Microbiological Quality 2018–2020• REMI, the Shellfish Production Zone Microbiological Monitoring Network, enables health surveillance of production zones exploited by professionals based on Escherichia coli counts in live shellfish (see methodology). • During 2018–2020, Escherichia coli counts assessed microbiological quality at 397 monitoring points along metropolitan French coasts, distributed across 302 shellfish production zones (one zone may have multiple monitoring points): 125 points monitor burrowing bivalve zones (cockles, clams, etc.) and 272 points monitor non-burrowing bivalve zones (oysters and mussels). • Microbiological quality of 397 shellfish bacteriological monitoring points is distributed as follows: good for 105 points (26%); average for 260 points (66%); poor for 23 points (6%); very poor for 9 points (2%). • Zone classification and monitoring are specific to shellfish groups. These groups are defined by regulation (Order of November 6, 2013) and reflect the differential capacity of shellfish to become contaminated and decontaminated. • Generally, contamination profiles at burrowing bivalve monitoring points are more degraded (18% in poor to very poor quality) than non-burrowing bivalves (3% in poor to very poor quality). However, the majority of monitoring points show average quality for both shellfish groups (70% for burrowers, 64% for non-burrowers). • Analysis by maritime coast shows that bacteriological quality of shellfish production zones remains good or average for over 90% of monitoring points on the English Channel–North Sea, North Atlantic–West English Channel, and South Atlantic coasts. On these three coasts, monitoring points rated average quality vary between 53–76%, while those rated good quality range from 14–45%. Overall, the North Atlantic–West English Channel coast has the highest number of monitoring points (237 distributed across 170 production zones). • The Mediterranean coast presents the most degraded quality profile, with 36% of monitoring points classified as poor and very poor quality. However, this coast has the fewest monitoring points (36 distributed across 31 production zones).Microbiological Quality Trends• Between 1991 and 2020, the number of points for which microbiological quality could be assessed doubled, rising from 197 during 1989–1991 to 397 in 2018–2020. This increase results from two main reasons: first, methodological data treatment—only historical data corresponding to currently monitored REMI points or recently discontinued monitoring are included. Second, improved surveillance in certain sectors, where significant effort has been invested for years to collect samples from difficult-to-access points, enabling sufficient data for quality assessment. • Although production zones and monitoring points have changed over time, REMI network data allows general quality assessment since its implementation. Across the entire period, shellfish microbiological conditions in production zones show good and average quality for over 90% of monitoring points during 22 of the 30 periods considered. The share of monitoring points rated average quality remains dominant (over 59%). • The least favorable years for quality were 1993–1995, 2007–2010, 2013, and 2014. During these years, over 10% of monitoring points were rated poor and very poor quality. On average since 1991, poor and very poor quality points represent 6% and 3% respectively.Analysis by Maritime Coast• Since the microbiological monitoring network was established in shellfish production zones, the North Atlantic–West English Channel coast has consistently had the highest number of monitoring points. This number more than doubled since 1991 to reach 237 points in 2020, representing 60% of all network points. On this coast, good and average quality points exceed 90% for 21 of the 30 monitoring periods. Poor and very poor quality points remain, on average, around 6% and 2% respectively. • On the English Channel–North Sea coast, monitoring points increased by 35% over the 30-year period. Average quality points remain dominant (between 62–88%) while good, poor, and very poor quality points vary discontinuously. The least favorable periods were 1993–1996, 2009, 2013, and 2014. During these years, the English Channel–North Sea coast had over 20% of monitoring points in poor and very poor quality. • The South Atlantic coast stands out from the other three coasts due to very few poor and very poor quality points (1% average between 1991 and 2020). Good and average quality points exceed 95% for each of the 30 periods considered. On this coast, monitoring points increased by 41% between 1991 and 2020. • The Mediterranean coast has fewer monitoring points than the other three coasts. During the first monitoring decade, points were limited (around 11 points) then increased gradually to 36 points in 2020. This increase reflects sampling efforts begun in 2005 for burrowing bivalves, which began showing results in 2007 (2005–2007 period). However, increased monitored points coincided with increased poor to very poor quality points, reaching 13 points in 2020, representing 36% of monitoring points.Table 1. Production zones and average monitoring pointsLearn More• Interactive map referencing REMI points. • Click the map to access data. • As a network protecting consumer health, REMI points are positioned in production zones at the sector identified as most exposed to contamination. Microbiological contamination sources vary widely and quality at monitoring points (and/or zones) typically results from multiple combined sources from nearby watersheds or local/occasional releases (e.g., raw wastewater discharge on or near production zones). Quality degradation can result from demographic changes making existing wastewater treatment infrastructure inadequate, contamination in storm systems, dysfunctions from heavy rainfall, seasonal population variations (tourism), agricultural practice changes (livestock, land spreading), illegal wastewater discharges (pleasure boats, campers), or wildlife presence. • Quality recovery can result from watershed improvements (wastewater collection systems, treatment plants, autonomous sanitation systems). Identifying contamination sources, ranking them, are essential but sometimes complex steps to identify priority actions for authorities to improve water quality and consequently shellfish production zone quality.Indicator InformationTerritory: metropolitan France. Source: Ifremer, Quadrige database—shellfish product bacteriological quality monitoring network (REMI) (data extracted March 2022). Processing: Ifremer/REMI, CGDD/SDES, 2022. Editor: Statistical Data and Studies Service (SDES) of the Ministry of Ecological Transition (MTE) and French Institute for Marine Research Exploitation (Ifremer). Updated: every two years. Written: March 2022.Methodology• REMI, the Shellfish Production Zone Microbiological Monitoring Network, enables health surveillance of production zones exploited by professionals and classified by the Administration. Based on Escherichia coli (E. coli) counts in live shellfish—bacteria common to digestive systems, used as fecal contamination indicator—REMI objectives are: estimate microbiological quality of shellfish production zones; monitor microbiological quality level evolution; detect and track unusual contamination episodes. • Microbiological classification and monitoring of live shellfish production and relaying zones follow thresholds in Article 52 of Commission Implementing Regulation (EU) 2019/627, Order of November 6, 2013, which provides classification by three classes (A, B, C) based on fecal contamination level. Classification follows fecal contamination indicator Escherichia coli concentration criteria in shellfish. Classification conditions shellfish marketing: Class A zones allow direct sale, Class B zones require purification before sale, Class C zones require thermal treatment or relaying. Measurements outside A, B, C class criteria were placed in category D "very poor" or "unclassified." • [1] Commission Implementing Regulation (EU) 2019/627 of March 15, 2019 laying down rules for the performance of official controls concerning products of animal origin intended for human consumption in accordance with Regulation (EU) 2017/625 of the European Parliament and of the Council and amending Commission Regulation (EC) 2074/2005 concerning official controls. • [2] Order of November 6, 2013 concerning classification, monitoring, and health management of live shellfish production and relaying zones. • REMI point microbiological quality is determined based on regular surveillance results obtained over the last three calendar years for each monitored shellfish group (Group 2: burrowing filterer bivalves; Group 3: non-burrowing filterer bivalves). Four levels are defined: Good quality: at least 80% of results ≤230 and 100% of results ≤700 E. coli/100g CLI (Meat and Intervalvular Liquid); Average quality: 90% of results ≤4,600 and 100% ≤46,000 E. coli/100g CLI; Poor quality: 100% of results ≤46,000 E. coli/100g CLI; Very poor quality: if one result >46,000 E. coli/100g CLI. • REMI point microbiological quality evolution is determined using all available historical data. Only points with sufficient data for each three-year calendar period are considered (24 or 12 results for bimonthly-frequency points). Quality is determined from data acquired over three calendar years and rolling year between 1991 and 2020.Useful Links
Further reading
- Le Réseau de Contrôle Microbiologique des zones de production conchylicoleswwz.ifremer.fr
- Ministère chargé de la Santé : Qualité des eaux de baignadebaignades.sante.gouv.fr
- Milieu Marin France : Questions sanitairesmilieumarinfrance.fr