L’évolution des flux d’azote et de phosphore à la mer depuis 2000
Les cours d’eau véhiculent de nombreux nutriments jusqu’à la mer en drainant l’ensemble du territoire. En mer, les surplus de nutriments, notamment l’azote et le phosphore, conduisent à des phénomènes d’eutrophisation marine et à la prolifération d’algues vertes. La France mène tous les ans des évaluations des flux de polluants à la mer via les cours d’eau au titre de la convention Ospar et du programme MED POL d’évaluation et de maîtrise de la pollution marine dans la région méditerranéenne.
Waterways carry many nutrients to the sea by draining the entire territory. In the sea, surplus nutrients, particularly nitrogen and phosphorus, lead to marine eutrophication phenomena and green algae proliferation. France conducts annual evaluations of pollutant flows to the sea via waterways under the Ospar convention and the MED POL programme for the assessment and control of marine pollution in the Mediterranean region.
3 chapters
- General overview2019 flowsIn 2019, 461,000 tonnes of nitrogen in the form of nitrates and 11,900 tonnes of total phosphorus were discharged into the sea via mainland waterways. The nitrates reaching the sea come mainly from agriculture (leaching of surplus mineral and organic fertilizers applied to crops and partly migrating to groundwater and waterways). Phosphorus comes mainly from urban wastewater.2000–2019 trendOver the period from 2000 to 2019, the flows of nitrogen linked to nitrates reaching the sea remained stable with an average of 495,000 tonnes/year. Those of phosphorus decreased by 68% over the period (36,900 tonnes in 2000 compared to 11,900 tonnes in 2019). This decline is notably linked to improved performance of wastewater treatment plants, the ban on the use of phosphates in detergents, the increase in the number of residents connected to collective sanitation systems and to a lesser extent the reduction in the use of phosphate fertilizers in agriculture.ChartTrends in nitrogen flows from nitrates and total phosphorus reaching the sea between 2000 and 2019
- Analysis by maritime area
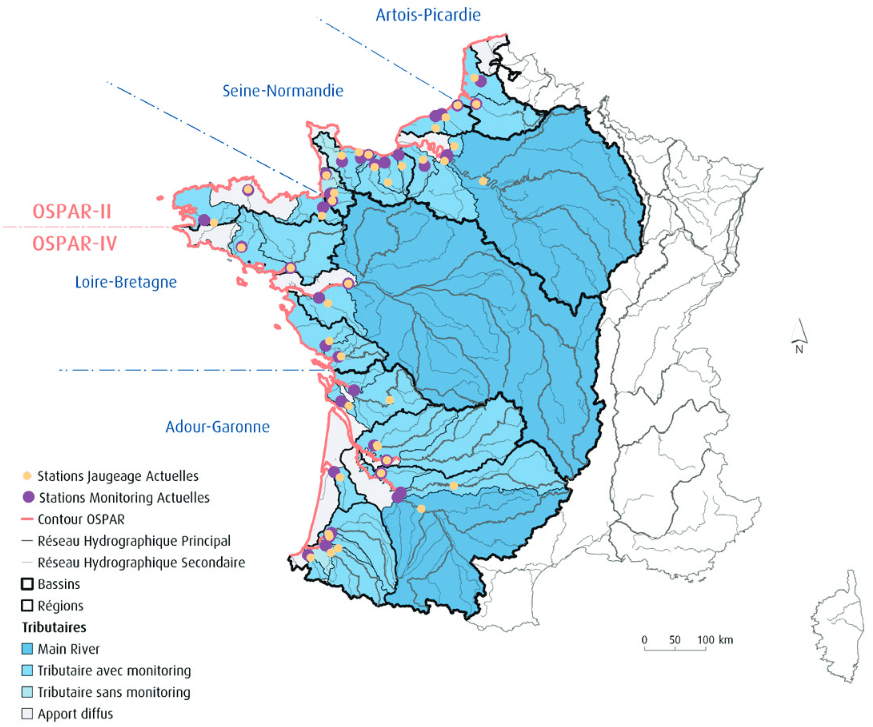
- Nitrogen flows from nitratesPhosphorus flows• From 2000 to 2019, the Atlantic maritime area received on average 264,000 tonnes of nitrogen in the form of nitrates each year, representing more than half (54%) of the flows reaching the sea and transiting through mainland waterways. The Channel–North Sea maritime area was the outlet for 150,000 tonnes on average annually, or 30% of the flows, and the Mediterranean 79,000 tonnes per year (16%). • Trends in nitrogen flows from nitrates reaching the sea by maritime area • Annual flows of total phosphorus declined across the three maritime areas between 2000 and 2019. Over this period, the Atlantic maritime area received on average annually half of the phosphorus discharged into the sea by mainland waterways. The Channel–North Sea maritime area received 21% and the Mediterranean 29%. • Trends in total phosphorus flows reaching the sea by maritime areaLearn more: territories overview• The metropolitan territories, whose outlets correspond to maritime spaces monitored under the Ospar and Medpol conventions, cover 520,000 km², representing 95% of the entire territory. The remaining 5% corresponds to the northeast strip of the mainland, whose rivers continue their course in Belgium, Germany and Luxembourg, and is therefore not included in this study. • The territories with the Channel and the North Sea as their outlet cover 23% of the study area, those of the Atlantic 51% and the Mediterranean 26%. • Location of territories included under the Ospar convention framework • Source: IGN, MEDAD and water agencies, BD Carthage®, 2006; MEDAD, Banque Hydro, 2008 • > Methodology • > For several years, France has evaluated annually the flows of pollutants to the sea of nitrogen and phosphorus via waterways under the Ospar conventions for the Channel, the North Sea and the Atlantic (Riverine Input Discharges programme), and Medpol for the Mediterranean region. The Ospar commission provides a flow calculation software, RTrend®, on which the results presented here are based. Since the Medpol convention did not specify a methodology, the Ospar recommendations are extended to the Mediterranean basin. • > The flows are calculated on the total (dissolved and particulate phase) of nitrogen or phosphorus. These are estimations due to sometimes limited number of analyses on the one hand and the fact that flood episodes, which can transfer significant quantities of pollutants, are poorly covered on the other. The calculated flows therefore cannot be strictly considered as real flows. • > The flow of a chemical substance to the sea is calculated by multiplying the waterway discharge by the concentration of this substance in it. To facilitate comparisons between different molecules containing nitrogen, ammonia nitrogen and nitrate flows are expressed as equivalent nitrogen element. • > Examples: – a concentration of 50 mg of nitrate/litre is equivalent to a concentration of 11.3 mg of nitrogen element/litre, according to the share that the mass of the nitrogen element represents in the mass of the nitrate molecule (unit conversion factor = 4.42). • > – a concentration of 50 mg of ammonia nitrogen/litre is equivalent to a concentration of 39.1 mg of nitrogen element/litre (unit conversion factor = 1.28). • > Applied to annual flows, these unit conversions give: 100 kT of ammonium NH4/year are equivalent to 77.8 kT of nitrogen element N/year and 100 kT of nitrate NO3/year are equivalent to 22.6 kT of nitrogen element N/year. • > Three types of waterways are distinguished: main rivers, secondary waterways or tributaries and diffuse input areas that are not drained by a significant waterway (see maps at the end of the sheet). On each waterway, monitoring and flow stations are selected so as to have the longest possible time series. • > Author: Institut Français de Recherche pour l'Exploitation de la Mer (Ifremer).
Further reading
- Nitrates et orthophosphates continuent de baisser dans les rivièresnotre-environnement.gouv.fr
Les indices nitrates et orthophosphates ont nettement baissé durant les 20 dernières années en métropole. Cette baisse est le reflet des mesures prises pour réduire les rejets industriels, urbains et agricoles.