
Nitrates et orthophosphates continuent de baisser dans les rivières
Les indices nitrates et orthophosphates ont nettement baissé durant les 20 dernières années en métropole. Cette baisse est le reflet des mesures prises pour réduire les rejets industriels, urbains et agricoles. Des améliorations dans le traitement des eaux usées aussi. Toutefois, la baisse ne s’observe pas dans tous les territoires.
Nitrate and orthophosphate indices have declined significantly over the past 20 years in mainland France. This decline reflects measures taken to reduce industrial, urban, and agricultural discharges, as well as improvements in wastewater treatment. However, the decline is not observed in all regions.
2 chapters
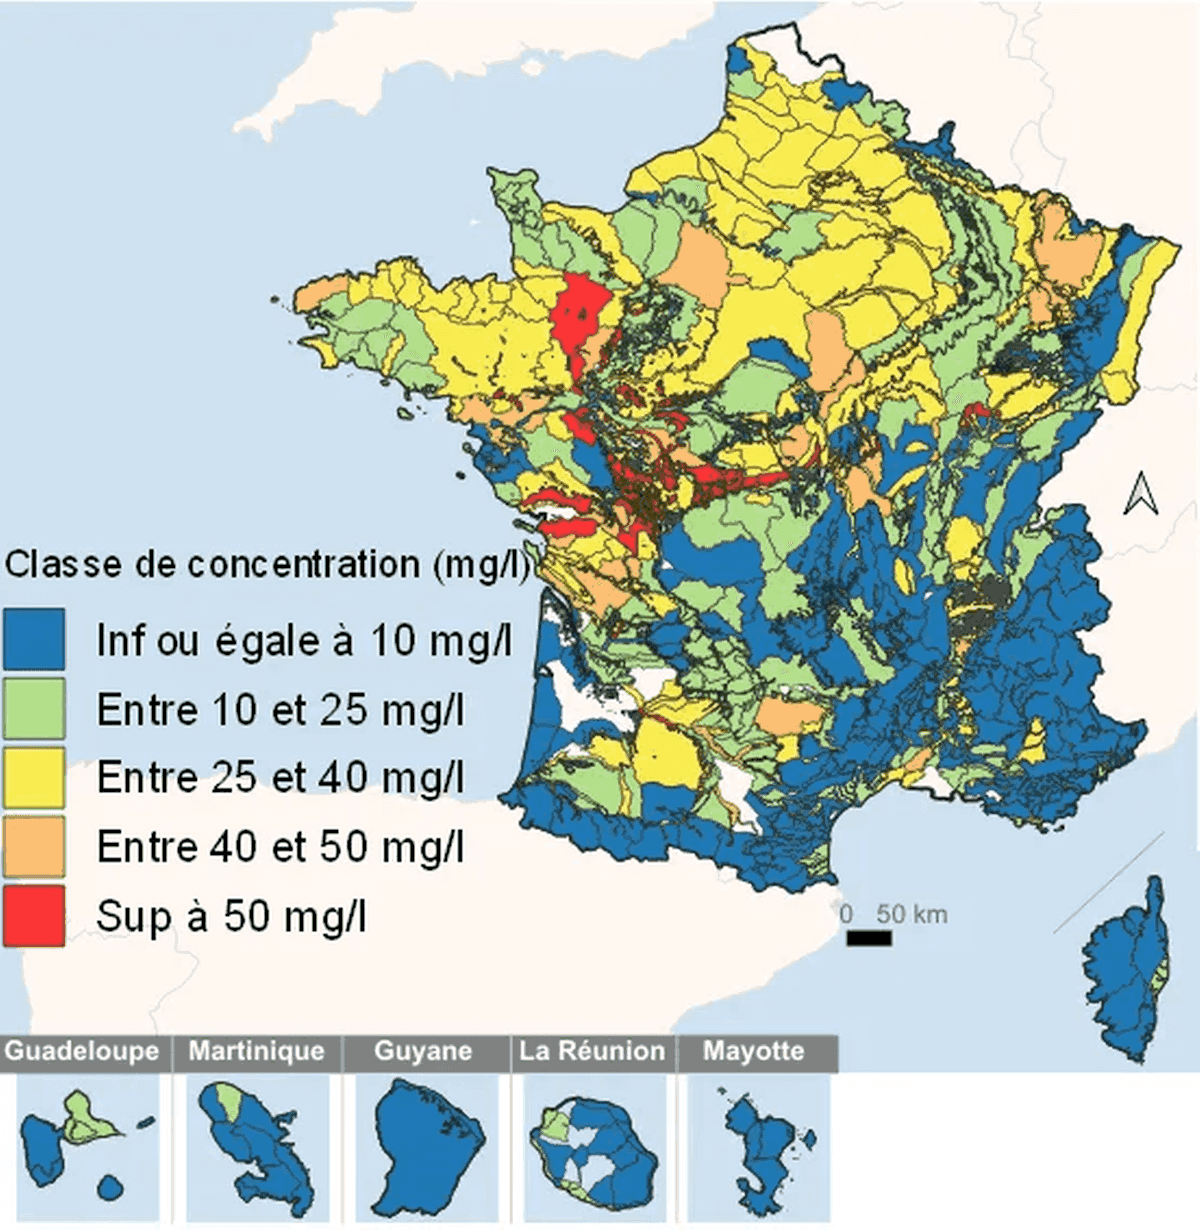
- NitratesNitrate index down 12% between 1998 and 2017None of the 6 major hydrographic basins in mainland France show an upward trend over this period. The most significant declines are observed in Adour-Garonne and Rhône-Méditerranée-Corse. The Artois-Picardie and Rhine-Meuse basins show the least pronounced declines, while Loire-Brittany and Seine-Normandy are close to the overall average trend.Highly variable concentrations across regions• Over 2015-2017, average nitrate concentrations in the 55 catchment basins vary from 1 to 32 mg/L. Half exceed 14 mg/L and one quarter exceed 21 mg/L. • Four Seine-Normandy catchment basins have particularly high average concentrations (> 20 mg/L). They also show a chronic deterioration trend (index up 11 to 50% between 1998 and 2017). • In contrast, seven Western catchment basins have similarly degraded conditions (15-25 mg/L) but tend to improve over the long term (index down 11 to 50%).
- OrthophosphatesClear downward trend over past 20 years• At the metropolitan scale, the orthophosphate index drops by 37% between 1998 and 2017. It declines by over 40% in four major basins and increases slightly in Rhine-Meuse (+2%). • In total, 48 catchment basins show a declining index.Homogeneous average concentrations across regions• Unlike nitrates, concentration variability is lower: most catchment basins fall between 0.1 and 0.2 mg/L and are considered in "good chemical status" for this parameter under the Water Framework Directive. • Overall, the range of average inter-basin concentrations is 0.02 to 0.64 mg/L over 2015-2017. • The most degraded conditions are found in 2 catchment basins in Artois-Picardie and Rhine-Meuse (> 0.4 mg/L), with one showing a declining index and the other rising. The least degraded conditions are in 3 Rhône-Méditerranée-Corse basins (< 0.05 mg/L). • > Nitrates and phosphates in Europe: The 2018 report from the European Environment Agency indicates nitrate concentrations in European watercourses decreased 20% between 1992 and 2015, and phosphate concentrations by approximately 50%. • > Methodology • > Spatial and temporal coverage: Data for this study are extracted from the Naïades database of the water information system: www.eaufrance.fr. They cover the period from 1998 to present. Overseas departments are not included in the study. • > Analysis results are processed at the scale of 6 major metropolitan hydrographic basins and their subdivision into 55 catchment basins. • > Each catchment basin comprises connected hydrographic sub-sectors. Each sub-sector corresponds to a physical watercourse basin or a group of small watercourses with a homogeneous outlet. • > Monitoring data: Measurement points of monitoring networks are selected if: they have at least 1 water sample taken per quarter (total of at least 4 samples per year); they are present for at least two consecutive years. • > Concentration evolution index calculation: Annual average concentrations are calculated for each measurement point. They enable biannual evolution coefficients to be calculated at catchment basin scale. • > When a coefficient is missing from a time series, it is replaced by the weighted moving average of the 2 preceding and 2 following coefficients. For example, if a value is missing at position i, it is replaced by the average of positions i-1 and i+1 weighted by 0.5, and positions i-2 and i+2 weighted by 0.25. • > The basin index is then calculated by chaining coefficients from a base of 100, set in 1998. The metropolitan index is the average of catchment basin indices weighted by their area. • > The rate of change over the study period is calculated by linear regression of the index against years.