Les émissions de gaz à effet de serre des transports
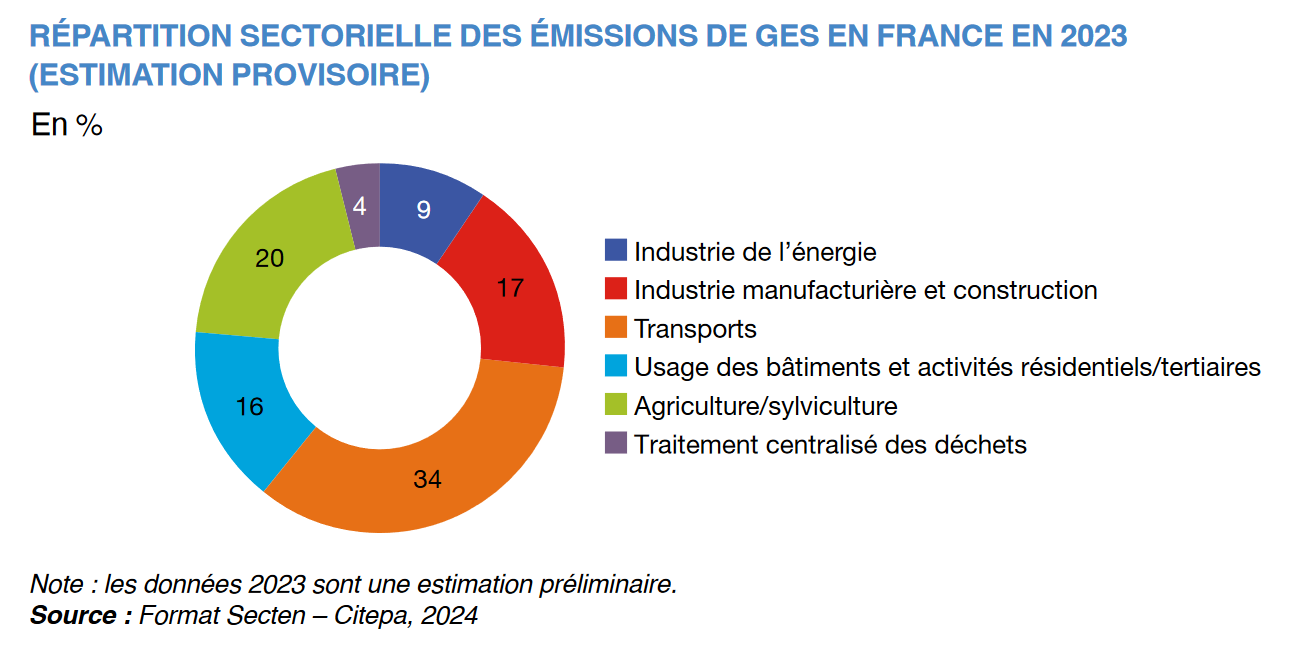
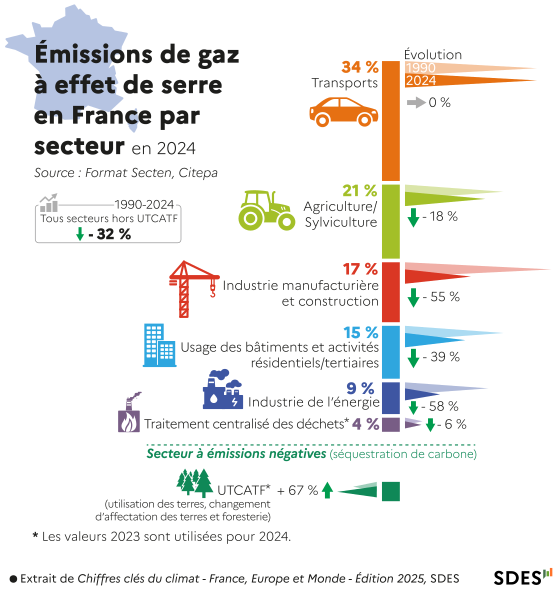
Le transport est l’activité qui contribue le plus aux émissions de gaz à effet de serre de la France. En 2023, c’est un tiers des émissions françaises. Même si les émissions des transports sont en baisse depuis 2019, il s’agit du seul secteur où elles ont augmenté depuis 1990 (+ 3 %), car l’amélioration de la performance environnementale des véhicules ne compense pas l’augmentation de la circulation. La quasi-totalité de ces émissions (94 %) provient du transport par la route, et en majorité des véhicules particuliers. Découvrez ici le détail des émissions du secteur et de leur évolution.
Transport is the activity contributing most to France's greenhouse gas emissions. In 2023, it accounts for a third of French emissions. Although transport emissions have declined since 2019, this is the only sector where they have risen since 1990 (+3%), as the improved environmental performance of vehicles does not offset increased traffic. Nearly all these emissions (94%) come from road transport, mainly private cars. Discover here details of sector emissions and their evolution.
- Greenhouse gas emissions from transport: what are we talking about?How are transport emissions counted?• The transport sector includes all journeys made in France, whether transporting goods or people. • International transport is excluded from the national total. Only emissions from journeys between two ports or airports located in France are counted. • For road transport, emissions come from French vehicles as well as foreign heavy goods vehicles in international transit. • Emissions do not account for those linked to vehicle manufacturing or fuel production (recorded in industrial sectors). • GHG emissions related to electricity production are not counted in the transport sector, but in energy and energy transformation.Key figures on transport greenhouse gas emissionsIn 2023, transport is the sector emitting the most greenhouse gas in France. It accounts for 34% of French emissions with 126.8 million tonnes of CO2 equivalent. In 1990, it was the 2nd largest emitting sector, representing only 23% of the national total greenhouse gas emissions.
- Greenhouse gas emissions by transport modeFrench emissions mainly from road transport• Road transport accounts for nearly all transport emissions in France: 94% in 2023. 6% come from air, maritime, inland waterway and rail transport, especially since international transport is not counted in French emissions. • Transport emissions are mainly due to people traveling in private cars. Used primarily by households, they account for more than half (53%) of transport sector emissions, though there is a recent downward trend. • Heavy goods vehicles, including buses and coaches, account for 24% of transport sector emissions, light commercial vehicles 16%, and two-wheelers 1%.GHG emissions by transport modePer kilometer, aircraft emit most, just ahead of petrol cars• Journey emissions depend largely on the transport mode used. • Walking or cycling: these modes emit no greenhouse gas. • Train: between 3 and 30 grams of CO2 per kilometer per passenger depending on line electrification. • Coaches and buses: emissions per kilometer per passenger are 29 grams for a coach versus 113 grams for an urban thermal bus. • Car: a petrol car emits on average 218 grams of CO2 per kilometer versus 103 grams for an electric car including vehicle manufacturing. Per-person emissions depend on the number of passengers. • Aircraft: aircraft emissions per passenger vary widely depending on aircraft size and characteristics, service quality and flight duration. A plane passenger emits on average 259 grams of CO2 per kilometer.
- Evolution of transport greenhouse gas emissionsRise contrary to national trend• While national greenhouse gas emissions fell 31% between 1990 and 2023, transport emissions rose 3%. Transport is the only sector whose GHG emissions increased over this period. • CO2 emissions per kilometer traveled fell 24% between 1990 and 2023, due to improved fuel efficiency and the emergence of hybrid and electric vehicles. Yet these technological improvements are offset by increased road traffic, heavier vehicles, aging vehicle fleet and rising petrol motorization, which emits more CO2 than diesel.Carbon neutrality targets• In France, the goal is to achieve carbon neutrality by 2050, meaning a balance between emissions and absorptions of greenhouse gases. • The national strategy aims for near total decarbonization of transport emissions by 2050. An intermediate target of -28% emissions in 2030 compared to 2015 has been set.French and European regulatory measures• To achieve this, the law notably sets the goal of stopping sales of new thermal engine cars, meaning those using fossil fuels, by 2040. Another law added a ban on sales of cars emitting more than 95 grams of CO2 per kilometer from 2030. These laws should boost electrified vehicles. • At European level, Member States and the European Parliament have gone further by deciding to ban sales of new thermal engine cars from 2035. This is the date that will therefore also apply in France.
- Focus on private cars53% of transport GHG emissions• In 2023, 39.3 million vehicles emitted 67.4 Mt CO2, representing 53% of transport sector greenhouse gases and 18% of all national emissions. • As of January 1, 2024, nearly 91% of the fleet consists of petrol or diesel thermal energy cars. Diesel cars remain dominant (50.7%) even though their share was 63.9% in 2016. • Non-rechargeable hybrid vehicles account for 4.4% of the French car fleet as of January 1, 2024. Most (90.3%) are petrol hybrid motorization. Electric, hydrogen, plug-in hybrid and dual-fuel petrol-LPG motorizations account for 4.4% of the fleet as of January 1, 2024.Growth of electric vehicles• The electric car market, supported for years by an eco-bonus at purchase, has grown sharply since 2021 and accounted for 17% of registrations in 2023. These vehicles are now the leading alternative motorization to petrol and diesel, ahead of plug-in hybrid motorization, which has also grown strongly since 2021 with 9.2% of registrations in 2023. • Average CO2 emissions from cars registered in 2023 were 96.2 grams per kilometer compared to 102.7 in 2022. This reduction is mainly explained by the sharp increase in the share of electric cars in new registrations.
- Focus on light commercial vehiclesDefinition and emissionsLight commercial vehicles are vans for transporting people or goods with a maximum authorized gross weight not exceeding 3.5 tonnes. In 2023, they account for 15.4% of transport greenhouse gas emissions, or 19.5 million tonnes of CO2. Compared to 1990, this represents a 4.6% increase.Fleet in circulationAs of January 1, 2024, 6.5 million light commercial vehicles are in circulation in France. They are mainly vans (78% of the fleet), with 93.4% diesel vehicles.
- Focus on heavy goods vehiclesFleet and emissionsAs of January 1, 2024, the heavy goods vehicle fleet has 625,000 vehicles in circulation. These vehicle emissions represent 27.9 million tonnes of CO2 in 2023, or 22% of transport emissions.Emissions evolutionBetween 1990 and 2023, heavy goods vehicle GHG emissions rose 4.8% due to increased freight transport. Average unit CO2 emissions from heavy goods vehicles are estimated at 1209 grams of CO2 per kilometer in 2022, similar to 1990 levels.MotorizationNearly all heavy goods vehicles have diesel thermal motorization (97.7%).
- Focus on buses and coachesSector emissionsIn 2023, buses and coaches emitted 2.8 million tonnes of CO2, or 2.3% of total transport sector emissions.Fleet in circulationAs of January 1, 2024, 66,100 coaches and 27,800 buses are in circulation in France. Over the last decade, the total number of buses increased 30.8% while coaches grew 1.3%.Motorization trendsNew motorizations develop faster for buses than coaches given their uses: for buses, conversion to electric motorization is a key issue for improving air quality in major cities. Thus the diesel thermal market share in new bus sales has significantly declined, falling from 94.2% in 2014 to 12.0% in 2024.
- Focus on air, maritime and inland waterway transportAir transport• In 2023, domestic air transport emitted 4.5 million tonnes of CO2, or 3.5% of transport emissions. In 2023, air transport emissions (including international) account for 16.3 Mt, up 15.9% from 2022. • Although current levels are below those of 2004 to 2019, domestic and international air transport emissions exceed 1990 levels by 58.5%.Inland waterway and maritime transportNational inland waterway and maritime transport emitted 2.8 Mt CO2 eq in 2023, or 2.2% of transport sector emissions. Between 1990 and 2023, French inland waterway and maritime transport emissions rose 10%. Adding the calculated international share, total emissions reach 6.2 million tonnes of CO2.
- Focus on passenger transportDomestic passenger transport activityWith 1,033 billion kilometers traveled by passengers in 2023, domestic passenger transport remains stable (-0.3% year-on-year). Individual transport by private cars declines 1.6%. It remains the dominant mode for domestic passenger transport, with 82.2% share. Activity remains below 2019 levels, except for rail passenger transport which exceeds pre-crisis levels by 6.5%.
Further reading
- Les émissions françaises de gaz à effet de serrenotre-environnement.gouv.fr
Dans le cadre des engagements pris par la France, revue de détails de ses émissions de gaz à effet de serre, de leur évolution depuis 1990, et de la contribution de chaque secteur.
- Les chiffres clés des transports - édition 2025statistiques.developpement-durable.gouv.fr
Cette publication détaille les principaux chiffres et tendances du secteur des transports en France en 2023, y compris les émissions de GES. Service des données et études statistiques
- Chiffres clés du climat -France, Europe et Monde -Édition 2024statistiques.developpement-durable.gouv.fr
Cette publication détaille notamment les émissions de gaz à effet de serre par les différents secteurs en France, dont les transports. Datalab - Service des données et études statistiques - novembre 2024
- Données et études statistiques -Thématique “Transport”statistiques.developpement-durable.gouv.fr
Ce portail rassemble de nombreuses études et données liées aux transports en France, y compris sous l’angle des émissions des GES. Service des données et études statistiques
- Direction générale des infrastructures, des transports et de la mer (DGITM)ecologie.gouv.fr
Présentation de la DGITM, direction générale du ministère des Transports chargée de mettre en œuvre la politique nationale des transports terrestres et maritimes.
- Direction générale de l’aviation civile (DGAC)ecologie.gouv.fr
Portail de la DGAC, direction générale du ministère des Transports en charge du transport aérien.
- Forum International des Transports (FIT)itf-oecd.org
Portail du FIT, groupe de réflexion intergouvernemental de l’OCDE autour de la politique des transports.
- La Stratégie nationale bas-carbone (SNBC)ecologie.gouv.fr
Cette page reprend l’ensemble des informations et documents relatifs à la SNBC, ainsi qu’aux différents budgets carbone de la France. Ministère de la Transition écologique - octobre 2024
- La Stratégie nationale pour le fret ferroviaireecologie.gouv.fr
Cette page présente la Stratégie nationale pour le développement du fret ferroviaire et ses enjeux. Ministère de la Transition écologique & ministère de l’Aménagement du territoire
- Rapport Secten sur les émissions de GES en Francecitepa.org
Ce rapport est la référence concernant les émissions annuelles de gaz à effet de serre (et de polluants atmosphériques) en France depuis 1990. Citepa, juin 2024
- Bilan annuel des transports en 2023statistiques.developpement-durable.gouv.fr
Cette publication détaille de façon plus poussée encore tous les indicateurs clés du secteur des transports en France en 2023. Service des données et études statistiques