
Les émissions des gaz à effet de serre du secteur résidentiel
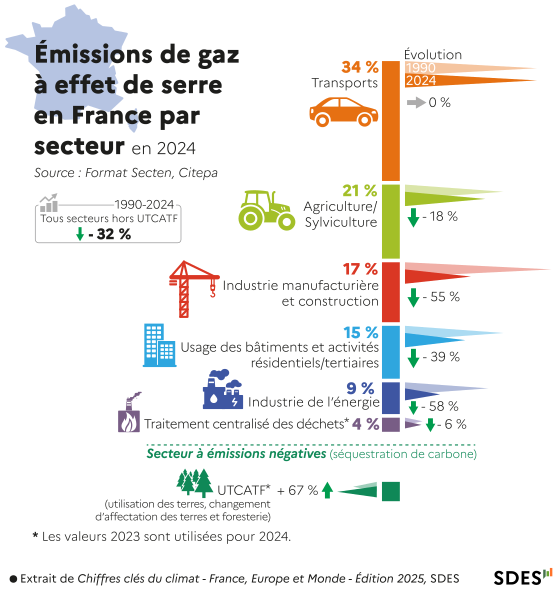
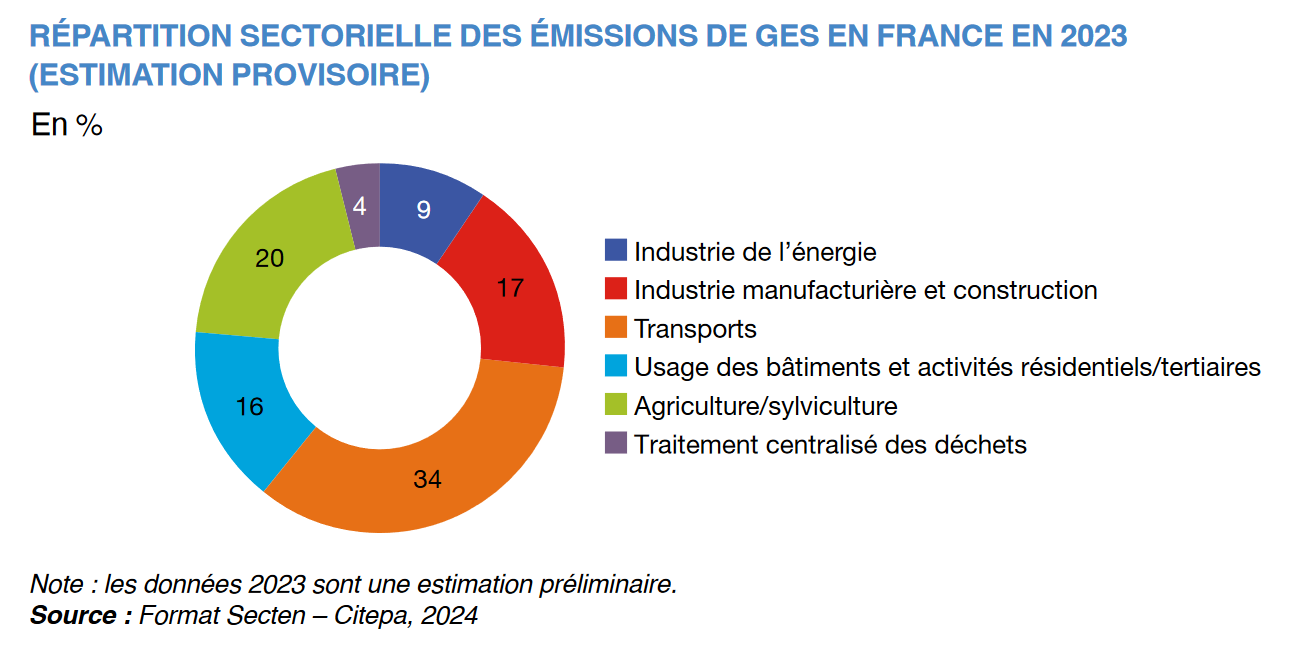
En 2017, le secteur résidentiel-tertiaire est le deuxième poste d’émissions de GES de la France (20 % du total national). Avec 91 Mt CO2e émis, le niveau d’émissions est identique à celui de 1990. Entre 1990 et 2017, les émissions de GES des logements ont diminué de 5 %. Cette légère baisse est cependant à mettre en regard de l’augmentation du parc et des surfaces de logement. En 2017, les résidences des ménages sont à l’origine de 58 Mt CO2e, soit 12 % du total national. Après avoir augmenté de 0,6 % par an en moyenne entre 1990 et 2010, elles diminuent de 2,3 % en moyenne par an, malgré les pics observés en 2015, 2016 et 2017.
In 2017, the residential and tertiary sector was France's second largest source of GHG emissions (20% of national total). With 91 Mt CO2e emitted, emission levels matched 1990 levels. Between 1990 and 2017, household GHG emissions decreased by 5%. This modest decline must be viewed against increased housing stock and residential floor area. In 2017, household residences generated 58 Mt CO2e, or 12% of the national total. After increasing 0.6% annually on average between 1990 and 2010, emissions declined 2.3% annually on average, despite peaks observed in 2015, 2016, and 2017.
- GHG emissions from the residential and tertiary sectorSector contribution to national GHG emissions• Between 1990 and 2008, the sector was France's third largest source of GHG emissions behind manufacturing and transport, and since 2009, the second largest source. In 2017, it accounted for 20% of France's GHG emissions, or 91 Mt CO2e. • Overall, from 1990 to 2017, two-thirds of the sector's emissions come from residential buildings. In 2017, emissions from residential buildings totaled 58 Mt CO2e, while those from tertiary sector buildings reached 34 Mt CO2e.GHG distribution• CO2 is the primary GHG emitted by the residential and tertiary sector. It comes from the consumption of fossil fuels (primarily heating oil and natural gas) by boilers to produce heating or domestic hot water. • By convention, CO2 emissions from biomass are not reported in inventories. Thus, CO2 emissions from wood heating are not counted. These emissions from fireplaces, wood stoves, or wood boilers represented 30 Mt CO2 in 2016, roughly one-third of the residential and tertiary sector's total GHG emissions. • The residential and tertiary sector is also characterized by high HFC emissions: 11% of the sector's GHG emissions compared to 4% of total national emissions. HFC emissions are related to building air conditioning and domestic refrigeration (refrigerators) and commercial cooling. At 10 Mt CO2e, HFC emissions from the residential and tertiary sector account for 54% of total national HFC emissions.Emissions trends• Between 1990 and 2017, France's GHG emissions decreased by 15%, reaching 466 Mt CO2e in 2017. Those from the residential and tertiary sector did not follow the same trend, with 2017 emission levels equivalent to 1990 levels at 91 Mt CO2e. • GHG emissions from the residential and tertiary sector show significant year-to-year variations, linked to climatic conditions, particularly winter weather. Indeed, especially in residential buildings, they primarily come from heating installations. • To analyze emission trends in the residential and tertiary sector without accounting for meteorological variables, energy statistics provide climate-adjusted energy consumption data. Climatic variations are corrected using a climate severity index that accounts for annual variations in average temperatures. The climate severity in 1990 was equivalent to 2017, so weather conditions had no impact on comparing GHG emission levels calculated for 1990 and 2017.
- The residential sectorEmissions evolution• In 2017, France's primary residential housing stock comprised 29 million dwellings, of which 43% are apartments. Half of the housing stock was built before 1975, and 20% of homes are less than 20 years old. Two-thirds of homes heated by heating oil date from before 1975. In 2017, approximately 300,000 new homes were built, representing 1% of the stock. Between 2016 and 2017, 0.5% of the stock was renewed. Single-family homes are primarily heated by electricity (32% of homes), natural gas (32% of homes), and heating oil (18% of homes). 7% of homes use wood heating. Natural gas (52% of apartments), electricity (33% of apartments), and district heating (10% of apartments) are the primary heating energy sources for apartments. 16% of new homes are heated using heat pumps. • Based on the perimeter retained in the national inventory for calculating residential sector GHG emissions, household emissions decreased by 5% between 1990 and 2017. Over the same period, total residential floor area increased by 49%. This represents a decoupling between the growth of heated areas and the evolution of GHG emissions from energy consumption or household air conditioning. This decoupling began in the mid-2000s. This relative decoupling between residential floor area and GHG emissions results from two factors: reduced energy consumption per m² and lower carbon intensity of consumed energy. • On a different perimeter than national inventories, accounting for CO2 directly or indirectly linked to consumption of all energy forms (including electricity and district heating) in homes for heating, cooking, domestic hot water, and electrical equipment, emissions decreased by 16% between 1990 and 2016. This decline is steeper than that observed for the perimeter retained for the residential sector in national inventories, due to the relative contribution of emissions from electricity and heat production. • The 16% reduction in CO2 emissions from residential use partly results from decreased energy consumption per m². This reduction in energy demand per m² reflects improved insulation of the housing stock. • Other factors may contribute to reduced consumption per m²: behavioral changes (desired temperature), technical performance of heating equipment (thermostats, boiler efficiency, individual metering for collective heating), or the type of energy used (for the same area, heating energy consumption varies depending on the energy type). • Between 1990 and 2016, average energy consumption per m² decreased by 31%. The average carbon intensity of energy also declined between 1990 and 2016: -20%. This trajectory reflects lower CO2 emissions from electricity production: increased reliance on nuclear and renewables and substitution of carbon-intensive fuels with cleaner alternatives (coal or heating oil replaced by natural gas). The same trend applies to heat production, increasingly from biomass. • Another variable affecting the reduction in average energy carbon intensity: decreased consumption of highly carbonized fuels (heating oil and coal) in homes, replaced by lower-carbon energy. Mitigation of CO2 emissions from residential use, achieved through reductions in energy carbon intensity and lower average energy consumption per m², was largely offset by energy demand driven by population increase and rising average living space per person. This larger average residential area per person partly reflects smaller household sizes and population aging. • Residential sector energy consumption levels in 2017 were similar to 1990: 452 and 449 TWh respectively. Given increased total residential floor area from population growth and larger average living spaces per person, average consumption per m² nonetheless decreased significantly between 1990 and 2017 (-29%). Average consumption per m² is estimated at approximately 170 kWh/m². This figure is indicative and based on actual climate (not accounting for winter severity). This unit value can vary significantly depending on perimeters used to calculate total residential floor area and energy consumption. • Between 1990 and 2017, the energy mix consumed in homes evolved substantially. Petroleum products (heating oil and liquefied petroleum gas) declined significantly in favor of natural gas and electricity. In 1990, coal, heating oil, and LPG represented 14% of energy sources used in homes. Petroleum product consumption has declined on average 1.5% annually since 1990. Coal and petroleum product consumption were replaced by increased natural gas use (+27% between 1990 and 2017). • Electricity became the most consumed energy form in homes in 2017: 32% of the total. However, the share of electricity consumption for heating remained relatively stable over the period: approximately 11%. The 50% increase in electricity consumption in primary residences therefore does not come from heating but from other uses: domestic hot water, cooking, and especially electricity-specific uses: lighting, household appliances, televisions, computers, internet boxes, etc. These uses represented 16% of consumption in 2017, up 77% since 1990. • Reduced building energy consumption became necessary following the 1974 and 1979 oil shocks and led to successive thermal regulations adopted in 1974, 1982, 1988, 2000, 2005, and 2012. Article 4 of the Grenelle 1 law established the objectives of RT 2012 by setting a maximum of 50 kWhEP/m².year on average. This standard for new construction characterizes low-energy buildings (BBC). The same law article defines strong ambitions for 2020 for new construction, which must demonstrate: "…primary energy consumption less than the quantity of renewable energy produced in these buildings, including biomass energy." • Furthermore, the state aims to encourage deployment of low-carbon buildings throughout their lifecycle by promoting biobased construction materials. This voluntary approach relies on the Positive Energy and Carbon Reduction (E+C-) label, promoting widespread adoption of positive-energy buildings (or Bepos) and deployment of low-carbon buildings throughout their lifecycle, from design through demolition. • Virtually all GHG emissions come from the existing stock, where the challenge is reducing overall energy consumption. This reduction requires massive renovation of the stock to significantly improve building insulation. Residential energy renovation is driven by public authorities as part of energy efficiency policies. These accompany households in financing renovation work (zero-interest loans, energy certificates, renovation aid, etc.). 11.6% of French households spend more than 8% of their income on energy bills. • > Methodology > GHG emissions from the residential and tertiary sector calculated for inventories include direct emissions from homes and tertiary sector buildings, namely those from combustion of fossil fuels (heating oil, natural gas) by individual and collective boilers, cooking appliances, or water heaters. > GHG emissions from urban heating plants producing heat consumed by buildings are not counted in the residential and tertiary sector but attributed to the energy industry sector. The same applies to emissions from electricity production (electricity consumption is not directly emissive of GHG). > CO2 emissions from wood are not, by convention, counted in inventories.Energy consumption• In 2017, the residential and tertiary sector was France's second largest GHG emissions source (20% of national total). With 91 Mt CO2e emitted, emission levels matched 1990 levels. Between 1990 and 2017, household GHG emissions decreased by 5%. This modest decline must be viewed against increased housing stock and residential floor area. In 2017, household residences generated 58 Mt CO2e, or 12% of the national total. After increasing 0.6% annually on average between 1990 and 2010, emissions declined 2.3% annually on average, despite peaks observed in 2015, 2016, and 2017.
Further reading
- Service de la donnée et des études statistiques : Consommation d’énergie des ménagesnotre-environnement.gouv.fr
Rubrique consacrée à la "Consommation d'énergie des ménages" sur le site du Service de la donnée et des études statistiques.
- Service de la donnée et des études statistiques : Logementnotre-environnement.gouv.fr
Les statistiques du logement et de la construction recouvrent des milliers de données issues d’enquêtes statistiques ou de sources administratives ainsi que des études structurelles ou des synthèses conjoncturelles.
- Bâtiment à énergie positive et réduction carbonenotre-environnement.gouv.fr
L’État et les acteurs de la construction s’engagent pour produire des bâtiments à énergie positive et bas carbone. À l'horizon 2018, la loi de transition énergétique pour la croissance verte permettra la mise en place d'un nouveau standard environnemental ambitieux et à l'horizon 2020, les bâtiments à énergie positive se généraliseront.
- Niveaux de performancenotre-environnement.gouv.fr
Rubrique consacrée aux "Niveaux de performance et label" sur le site "Bâtiment à Énergie positive & Réduction carbone".
- Plan de rénovation énergétique des bâtiments : Installation du comité de pilotage pour co-construire une France sobre en carbonenotre-environnement.gouv.fr
Nicolas Hulot, Jacques Mézard et Julien Denormandie, ont installé aujourd’hui le comité de pilotage du plan de rénovation énergétique des bâtiments.
- Ademe : Bâtimentnotre-environnement.gouv.fr
Rubrique consacrée au "Bâtiment" sur le site de l'Ademe.