
Les émissions de gaz à effet de serre du secteur de l’industrie manufacturière
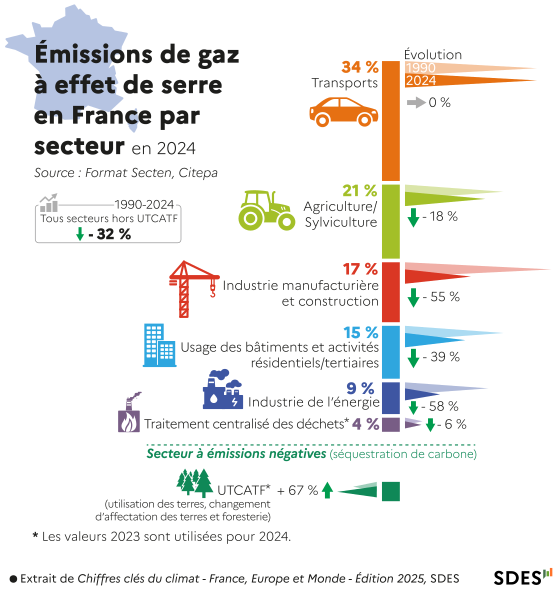
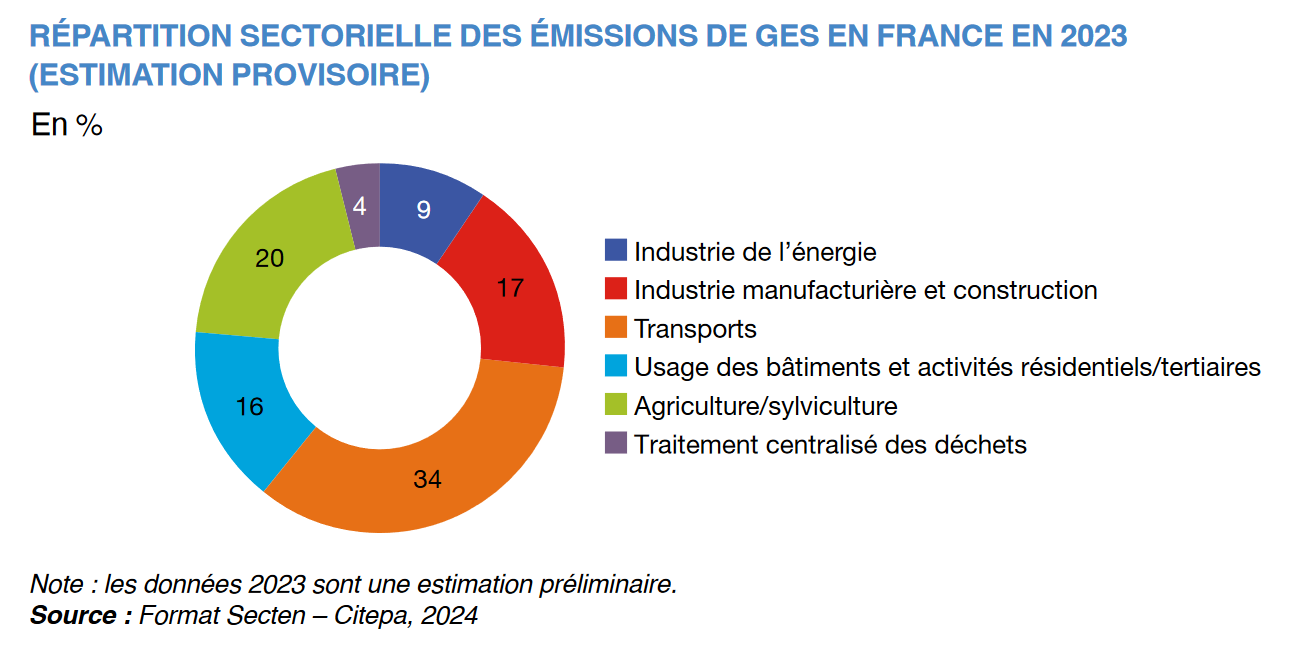
Le secteur de l’industrie manufacturière (hors activité liée au traitement des déchets et y compris activités de construction) est à l’origine de 78 Mt CO2 eq. émis en 2019. Ce secteur est le quatrième contributeur d’émissions de gaz à effet de serre (GES) sur le territoire national français. L’industrie chimique, la fabrication de matériaux de construction (ciment, verre, chaux, tuiles, etc.), la métallurgie et l’industrie agro-alimentaire sont les principales activités émettrices de GES. Environ un quart des GES émis par le secteur de l’industrie manufacturière résulte de processus de fabrication industriels. Le CO2 provenant de la décarbonatation (réaction chimique libérant du CO2, se produisant par exemple lorsque l’on chauffe du calcaire) compose près de la moitié de ces GES provenant de processus industriels. L’industrie manufacturière est le secteur ayant le plus réduit ses émissions de GES entre 1990 et 2019 (- 46 %). La baisse des GES dans l’industrie manufacturière représente 62 % de la réduction totale des émissions de GES de la France sur cette période.
Manufacturing industry sector (excluding waste treatment activities and including construction) generated 78 Mt CO2 eq. emitted in 2019. This sector is the fourth largest GHG contributor on French national territory. Chemical industry, construction materials manufacturing (cement, glass, lime, tiles, etc.), metallurgy and agro-food industry are main GHG-emitting activities. Approximately one-quarter of manufacturing GHG emissions result from industrial fabrication processes. CO2 from decarbonation (chemical reaction releasing CO2, occurring for example when limestone is heated) comprises nearly half of GHG from industrial processes. Manufacturing industry most reduced GHG emissions between 1990 and 2019 (- 46%). GHG decline in manufacturing represents 62% of France's total GHG emissions reduction over this period.
- GHG emissions from manufacturing industrySector scopeManufacturing industry encompasses activities involving physical or chemical transformation of materials, substances or products into other goods and construction activities. Energy production activities (refining, electricity generation facilities, fuel extraction) are not included in the manufacturing industry sector.Economic weight• Value added from manufacturing and construction activities represents 17% of national GDP. The construction sector accounts for 50% of value added in manufacturing industries (excluding refining activities). Agro-food industry (19% of manufacturing value added), transport equipment manufacturing, construction materials (glass, lime, cement, tiles, etc.) and plastics, metal industry, machinery construction and repair, chemistry and pharmaceuticals, electrical and electronic equipment manufacturing and woodworking constitute the sector's main activities. By volume, manufacturing value added increased 43% since 1990. Construction value added declined 5%. Manufacturing's contribution to GDP has been stable since 1990 (12% in 1990 versus 11% in 2019).Emission contribution• In 2019, manufacturing industry generated 78 Mt CO2 eq of GHG, making it the fourth largest emission source (18% of national inventory). In 1990, manufacturing was the largest emitter at 26% of national emissions. Chemical industry (25% of manufacturing emissions), construction materials and non-metallic mineral production (23%), metallurgy (20%) and agro-food industry (12%) account for most emissions.
- Different GHGs emitted by manufacturing industryCO2, main gas91% of manufacturing GHG emissions are CO2. Three-quarters of CO2 emissions (approximately 51 Mt) come from energy processes, whether specific or not to industrial production, and fuel consumption from construction equipment and mobile industrial machinery. Chemistry, agro-food, non-metallic minerals, iron and steel production (blast furnace iron production) and paper industry are the most energy-intensive activities.Industrial processes and decarbonation• The national GHG inventory submitted to UNFCCC indicates that for 2018, 23 Mt CO2 (41 Mt CO2 eq. including all GHGs) come from industrial processes. 10 Mt CO2 comes from non-metallic minerals and decarbonation. • Decarbonation is the transformation of carbon contained in carbonates (for example, limestone) into CO2 through heat. Cement, glass, lime, tile and brick production and steel production are affected by decarbonation. Synthesis of certain chemical compounds (adipic acid, nitric acid, glyoxylic acid) also leads to CO2 (6.5 Mt CO2) or N2O emissions (1 Mt CO2 eq.). Steel, aluminium, zinc and magnesium production processes also emit CO2 (4.4 Mt CO2).Other fluorinated gasesManufacturing industry is the only sector emitting NF3 and contributes 98% of PFC emissions. Additionally, 47% of SF6 is emitted by manufacturing industry. PFCs, SF6 and NF3 come from very specific productions: aluminium, trifluoroacetic, semiconductors, photovoltaic panels, non-ferrous metals. 4 Mt CO2 eq. of HFCs (26% of national emissions) are emitted by manufacturing industry (HFC manufacturing and HFC-propelled foam use in chemical industry and refrigeration in agro-food industry).
- Evolution of GHG emissions from manufacturing industryOverall decline since 1990• Between 1990 and 2019, all French emissions decreased 20%. Thus in 2019, France emits 108 Mt CO2 eq. less than in 1990. Manufacturing industry emitted 78 Mt CO2 eq. in 2019 (- 67 Mt CO2 eq.) less than in 1990, representing a 46% reduction. This decline is explained notably by energy savings and improved efficiency of industrial boilers required by regulations developed in 1998. • From 2008 onwards, due to economic crisis and production decline, emissions were sharply reduced in iron and steel and non-metallic minerals sectors. Manufacturing emissions in 1996 were at the same level as 1990. Emissions then decline at an average 2.7% annually until 2008, drop 17% between 2008 and 2009 and decrease regularly at 0.9% annually on average between 2009 and 2019. The beginning of GHG emissions decline in manufacturing preceded that of France overall by 10 years (1995 versus 2005 respectively).Evolution by activity branch• Chemical sector emissions, representing 25% of manufacturing emissions, declined 63% since 1990, non-metallic minerals and construction materials branch (23% of manufacturing emissions) declined 38% and ferrous metals metallurgy (20% of manufacturing emissions) declined 41%. • Only agro-food sector, representing 12% of manufacturing emissions, saw emissions increase (+ 12%). Since 1990, all substances show declining emissions: CO2 (- 34%), N2O (- 94%), HFCs (- 8%), CH4 (-33%), PFCs (- 87%), NF3 (- 26%), SF6 (- 88%) and manufacturing industry emissions decrease.Energy intensity and 2009 crisis• Energy-related CO2 emissions from manufacturing and construction decreased 32% between 1990 and 2018. This decline results from decreased energy intensity (- 38% between 1990 and 2018, averaging - 1.4% annually, accelerating to - 2.5% annually since 2005) and lower CO2 content in energy (- 22% over the period). • These figures reflect more efficient energy use in manufacturing processes and consumption of less carbon-intensive energy forms. These improvements were offset by increased industrial activity, formalized through higher production. The 2009 economic crisis impact is visible, with the production decline accompanying a GHG emissions contraction (- 18% between 2008 and 2009).
- Manufacturing in national low-carbon strategySNBC objectivesEstablished by the August 17, 2015 law on energy transition for green growth, the national low-carbon strategy (SNBC) is France's roadmap for climate change mitigation policy. SNBC 2, embedded in the November 8, 2019 law on energy and climate, sets the goal of achieving carbon neutrality by 2050 (balance between anthropogenic emissions and anthropogenic removals (natural sinks managed by humans, particularly forests, and industrial carbon capture and storage processes). SNBC aims for industrial emissions decarbonization between 1990 and 2050 (-81% between 2015 and 2050 and -35% between 2015 and 2030). By 2050, residual emissions in the industrial sector would be 15 Mt CO2 eq. (emissions deemed incompressible based on current knowledge and available technologies). SNBC considers breakthrough technologies (to eliminate industrial process emissions if possible), mobilization of decarbonized energy, improved energy efficiency and circular economy development to reduce industrial emissions.Industrial product emission factors• The diffusion of emission factors allows conversion of product masses into GHG. These emission factors account for average product production conditions. Non-metallic production materials (cement, lime, glass) have approximately 1 tonne CO2 eq. per tonne of material GHG content. Metals have highly variable emission factors by type. Per tonne of metal produced, copper contains 1.5 tonnes CO2 eq., steel 2.2 tonnes CO2 eq., aluminium nearly 8 tonnes CO2 eq. and nickel 9 tonnes CO2 eq. Fertilizers, plastic films and vehicles generate approximately 5 tonnes CO2 eq. per tonne produced.GHG and production: branch decomposition• Manufacturing and construction sector production increased 29% between 1990 and 2018. Construction, agro-food, transport equipment manufacturing, metallurgy and chemistry represent 72% of manufacturing and construction output. • Pharmaceuticals (+ 229%), computers and electronics (+ 155%), transport equipment (+ 84%) experienced strongest production growth. • Metallurgy and wood and paper industry production remain close to 1990 levels. Only textile industry production declined since 1990: - 57%. Manufacturing and construction output declined weakly between 1990 and 1997, then grew significantly until 2008 (+ 3.2% annually on average). Production dropped in 2009 with economic crisis. By 2018 production level recovered to pre-crisis levels. • Economic activity drives GHG emissions, yet the correlation between emissions and industrial production differs between 1990 and 2018. Decoupling between production growth and GHG emissions decline is more pronounced between 1996 and 2009. • Most production-intensive products come from plastic, rubber and non-metallic minerals (362 grams CO2 eq. /euro), metallurgy and metal products (247 grams CO2 eq. /euro) and chemical and pharmaceutical industry (219 grams CO2 eq. /euro). Transport equipment manufacturing and construction, representing 41% of output value, have lower production CO2 intensity (11 and 32 grams CO2 eq. per euro respectively). Production CO2 intensity was largely reduced across all activity branches (between - 23% and – 84% between 1990 and 2018) except construction which increased 21% in CO2 eq. per euro output (32 grams CO2 eq./euro in 2018). • Except construction and textile, all activity branches show decoupling of production (increasing) and GHG emissions (decreasing). This decoupling occurs around 1995 for most branches or early 2000s for agro-food and paper and wood industry. Construction is atypical, seeing emissions and production increase concurrently until 2011. For textiles, emissions decline with activity decline. Divergence between production and GHG emissions evolution is generally less pronounced from early 2010s.
- Evolution of emissions from industrial products in France's domestic demand carbon footprintDefinition and overall evolution• Carbon footprint represents GHG emissions associated with French consumption (domestic demand). It accounts for all emissions needed to produce goods and services consumed regardless of emission geographic origin. France's carbon footprint increased 20% between 1995 and 2005 then declined since 2011(-12% between 2011 and 2019). • Emissions evolution associated with manufacturing sector products (goods and services addressing French domestic final demand) is more pronounced. Manufacturing sector carbon footprint grew between 1995 and 2005 (+ 72%) and declined one-quarter between 2005 and 2019. Overall consumption level (domestic final demand) for these products increased more strongly than industrial products' carbon footprint (+ 26% between 1995 and 2005) and continued upward between 2005 and 2019 (+ 13%).Domestic production and imports• Two phenomena are observed: • domestic demand for domestic production excluding imports remains flat; • sharp decrease in domestic production GHG emissions. • This reflects lower GHG intensity of domestic industry (improved energy efficiency, less carbon-intensive energy use, increased lower-emission activities). Conversely, domestic demand for imports (by households and domestic production for input needs) doubles. Emissions from imports increased 25% between 1995 and 2005, then gradually declined to reach comparable 2019 levels to 1995. While overall industrial goods consumption increased (+ 41% between 1995 and 2019), mainly from higher imports, these products' carbon footprint declined 17%. This decline results from decreased CO2 intensity of domestic production and foreign trading partners' economic activities. Foreign industrial products' carbon content remains higher than domestic production goods. • Final demand is satisfied by domestic production and imports (finished products or raw materials and semi-finished goods consumed by domestic production). Between 1995 and 2019, domestic production advanced 29% while imports nearly tripled.
- European emissions trading systemETS principleManufacturing industry is subject to an emissions trading system organized within the European Union (ETS). The ETS principle aims to cap annual GHG emissions levels for certain industrial activities. The GHG emissions cap decreases progressively to lower overall GHG emissions. Facilities receive or purchase emission allowances they can subsequently resell or trade as needed. Companies cannot emit more GHG than authorized by their allowances under penalty of fine.Objectives and resultsThe ETS has existed since 2005 and concludes its third trading period (2013-2020). The European emission reduction objective for ETS sectors is set at -21% between 2005 and 2020 and -43% between 2005 and 2030. In 2019, 75% of energy and industrial sector emissions fall within ETS scope. Since 2005 national emissions (including energy and industrial sector) subject to ETS declined approximately 28% (39% at constant scope).
Further reading
- Ministère de la Transition écologique et solidaire : Climatnotre-environnement.gouv.fr
Rubrique consacrée au climat du site du Ministère de la Transition écologique et solidaire.
- Marchés du carbonenotre-environnement.gouv.fr
Les marchés carbone, également nommés systèmes d’échange de quotas d’émissions ou système de permis d’émissions négociables (Emissions Trading Schemes – ETS), sont des outils réglementaires facilitant l’atteinte pour tout ou partie des objectifs de réduction d’émissions de gaz à effet de serre (GES) déterminés politiquement.
- Rapport Secten sur les émissions de GES en Francecitepa.org
Ce rapport est la référence concernant les émissions annuelles de gaz à effet de serre (et de polluants atmosphériques) en France depuis 1990. Citepa, juin 2024
- Bilans GES : Centre de ressources sur les bilans de gaz à effet de serrenotre-environnement.gouv.fr
Un Bilan GES est une évaluation de la quantité de gaz à effet de serre émise (ou captée) dans l’atmosphère sur une année par les activités d’une organisation ou d'un territoire.