Le traitement des déchets
En France, 298 millions de tonnes (Mt) de déchets ont été collectées en 2022. Comment ces déchets sont-ils traités ? Quelles sont les évolutions des modes de traitement ? Comment traiter ces déchets de manière responsable ?
In France, 298 million tonnes (Mt) of waste were collected in 2022. How is this waste treated? What are the changes in treatment methods? How can this waste be treated responsibly?
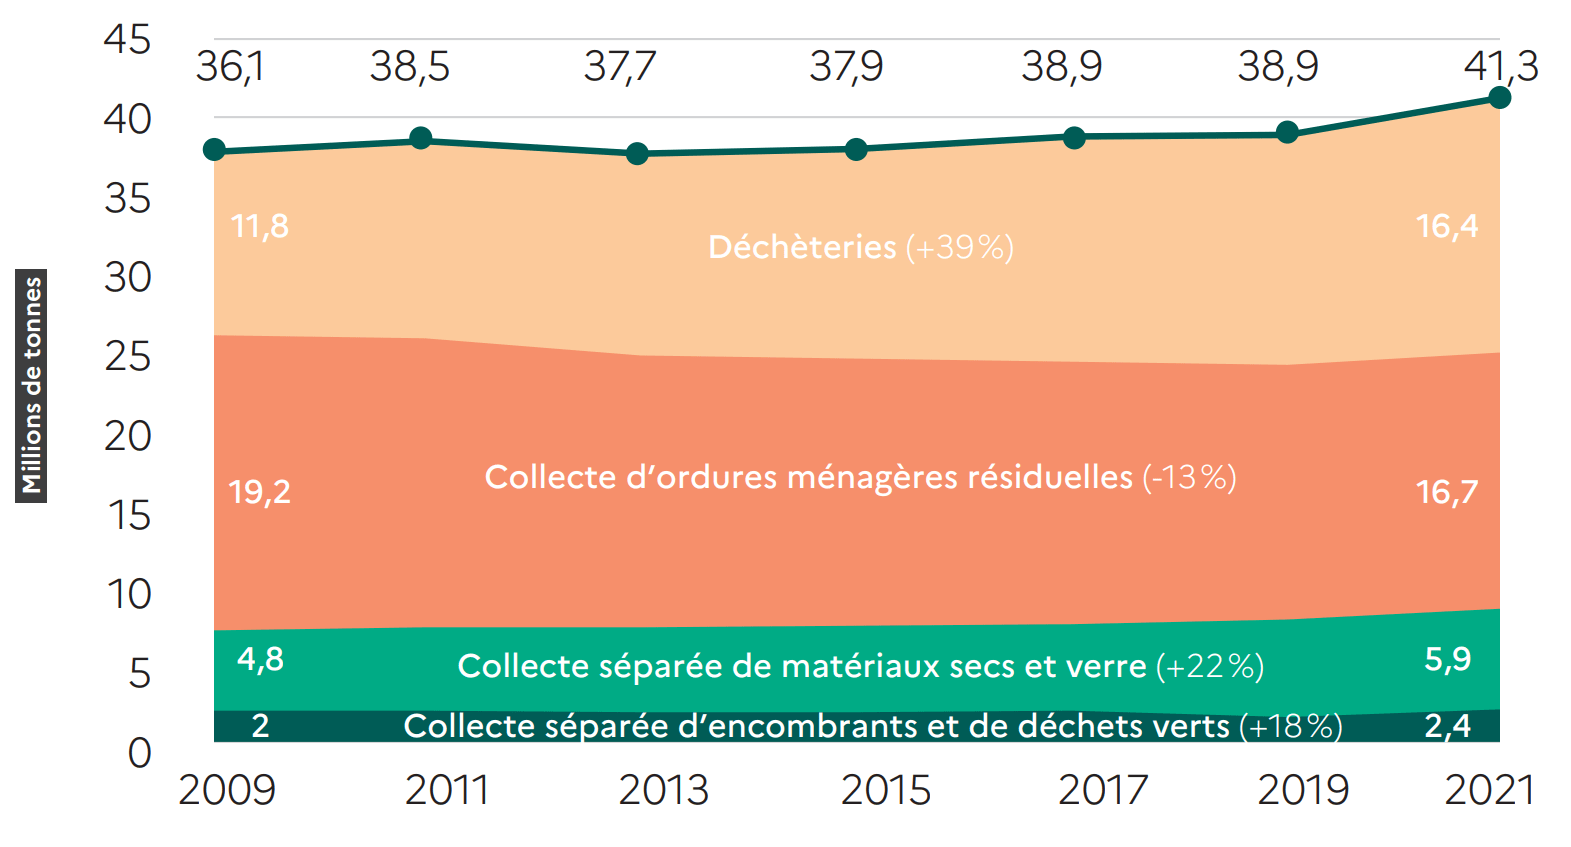
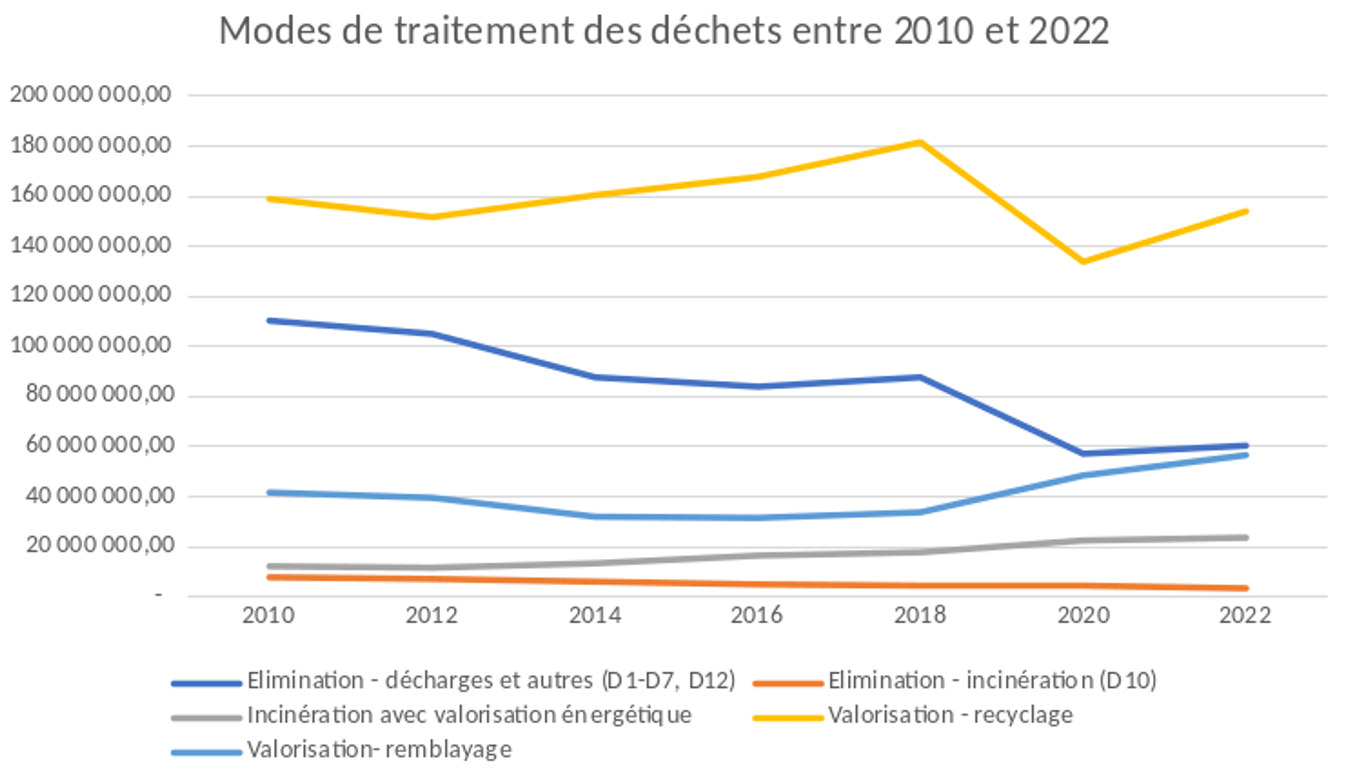
- Waste treatment by categoryGeneral overview• In 2022, 298 Mt of waste was treated in France by the Public Waste Management Service or by private operators. There are four types of treatment for this waste: • Incineration, with or without energy recovery through heat generated, representing 9% of waste; • Landfilling, placing waste in dedicated facilities, representing 20% of waste; • Backfilling, consisting of soil stabilization, representing 19% of waste, mineral waste only; • Recycling, which can take various forms, represents 52% of treatment across all waste types. • According to Eurostat, the recycling rate for all waste combined has been declining since 2018, falling from 55% to 52% in 2022. • Landfilling is also down 7% while incineration without energy recovery remains very low at 1%. • Conversely, backfilling increased 9% during this period and incineration with energy recovery increased 3%.Non-hazardous non-mineral waste• Non-hazardous non-mineral waste includes all waste produced by economic sectors, excluding mineral waste mainly from construction and hazardous waste. In France, 74% of this waste was recovered in 2022. • Recovery aims at reuse, recycling, or any action to obtain reusable materials or energy from waste. • Of this recovered waste, 46% was recycled through treatment facilities. 28% was incinerated with energy recovery. • 23% of non-recoverable waste was sent to waste storage centers (landfills) and 2% was incinerated without energy recovery. • Recovery of non-mineral non-hazardous waste increased in France between 2016 and 2022, rising from 70% to 74% of total tonnage. This increase is due to higher incineration with energy recovery, which rose from 21% to 28%. • The recycling rate fell 3% since 2016 to reach 46% of non-hazardous non-mineral waste treated in 2022. • Similarly, landfilling and incineration without energy recovery declined over the 2016–2022 period. • The national recycling report by ADEME (Agency for Ecological Transition) provides details by waste type. In 2017, the incorporation rate of scrap metal into steel production is 49%. For paper-cardboard it is 67%, meaning 67% of paper-cardboard produced in 2017 comes from recovered paper-cardboard. This rate is 56% for glass, bottles, and cup manufacturing.Hazardous waste• Hazardous waste (asbestos, pesticides, batteries, solvents, etc.) poses risks to human health and the environment and requires specialized treatment facilities. • It represents 7 tonnes in 2022, or 3% of treated waste. Its recovery is more complex than other waste due to its toxic, flammable, explosive nature, etc. • Only 47% of this waste is recovered, of which 32% through recycling and 14% through incineration with energy recovery. • The remainder is either landfilled (32%) or incinerated without energy recovery (14%). • Some hazardous waste has high recovery rates: over 80% of batteries and cells were recycled in 2018 thanks to the creation of collection and treatment systems. 90% of collected used oils were recovered, of which 70% were recycled. • Conversely, healthcare waste, chemical waste, and used solvents are mostly incinerated without energy recovery. Waste from waste treatment and hazardous mineral waste are largely buried. • The share of each hazardous waste treatment type remained relatively stable, varying by a maximum of 1% between 2016 and 2022.Mineral and inert waste• Mineral and inert waste is almost entirely waste from the construction sector (concrete, brick, glass, treated wood, etc.). It is not biodegradable but has little adverse impact on health or the environment. • 55% of mineral inert waste was recovered in 2022, exclusively through recycling. Backfilling mines and quarries accounts for 27%, and 19% is landfilled. • The total tonnage of mineral inert waste fell from 220 to 210 Mt between 2016 and 2022 and treatment types evolved significantly. • In 2016, recycling accounted for 72% of treated waste and landfilling for 28%. • Between 2016 and 2022, backfilling grew to reach 27% of treated waste in 2022. This treatment type partly replaces recycling, which declined 16%, and landfilling, which declined 9%.Plastic waste• Global plastic production has increased continuously since 1950. It rose from 0.6 kg to 47.7 kg per capita in 2019, totaling 368 Mt. French production is approximately 5 Mt, or 9.5% of European demand. • In Europe, 40% of plastic waste comes from packaging, 20% from construction, 10% from automotive, 6% from electronics. • In France, 43% of collected plastic waste is incinerated with energy recovery, 24% is recycled, and 32% is landfilled. • In 2017 in Europe, the recycling rate for all plastic waste reached 31% and exceeded the landfilling rate of 27%. This trend continued in 2018 with a recycling rate of 32%. Plastic packaging had a better recycling rate at 42%. • In France, the situation is below the European average: only 24% of plastic waste and 26% of plastic packaging waste are recycled in 2018. • One obstacle to plastic recycling is their great diversity. Approximately 50% of packaging is either non-recyclable or very difficult to recycle.Municipal and similar waste• Municipal and similar waste includes residual municipal waste (grey bin), selectively collected waste (yellow bin), waste from economic activities collected by the public service, household bulky waste, and waste collected at recycling centers. • In 2021, 41.3 Mt of municipal and similar waste was collected by the Public Waste Management Service, 6% more than in 2019. • In the mid-1990s, nearly half of municipal and similar waste, excluding rubble and gravel, was landfilled. Since 2017, landfilling has declined on average 3% per year, reaching 20% in 2019 according to ADEME. • The recovery rate through recycling and energy or organic recovery progresses and reaches 78% of municipal and similar waste excluding rubble and gravel in 2019, compared to 53% in 2000. • Results from the 2017 ADEME survey show a material and organic recycling rate of 43% for municipal and similar waste. It reached 47% in 2019. • Waste recycling is progressing strongly due to expanded selective collection linked to the opening of recycling centers. Indeed, approximately 4,600 were operational in 2019, three times more than in 1996. Incineration without energy recovery is now very low. Conversely, incineration with energy recovery is growing, rising from 29% of municipal waste in 2000 to 32% in 2019.
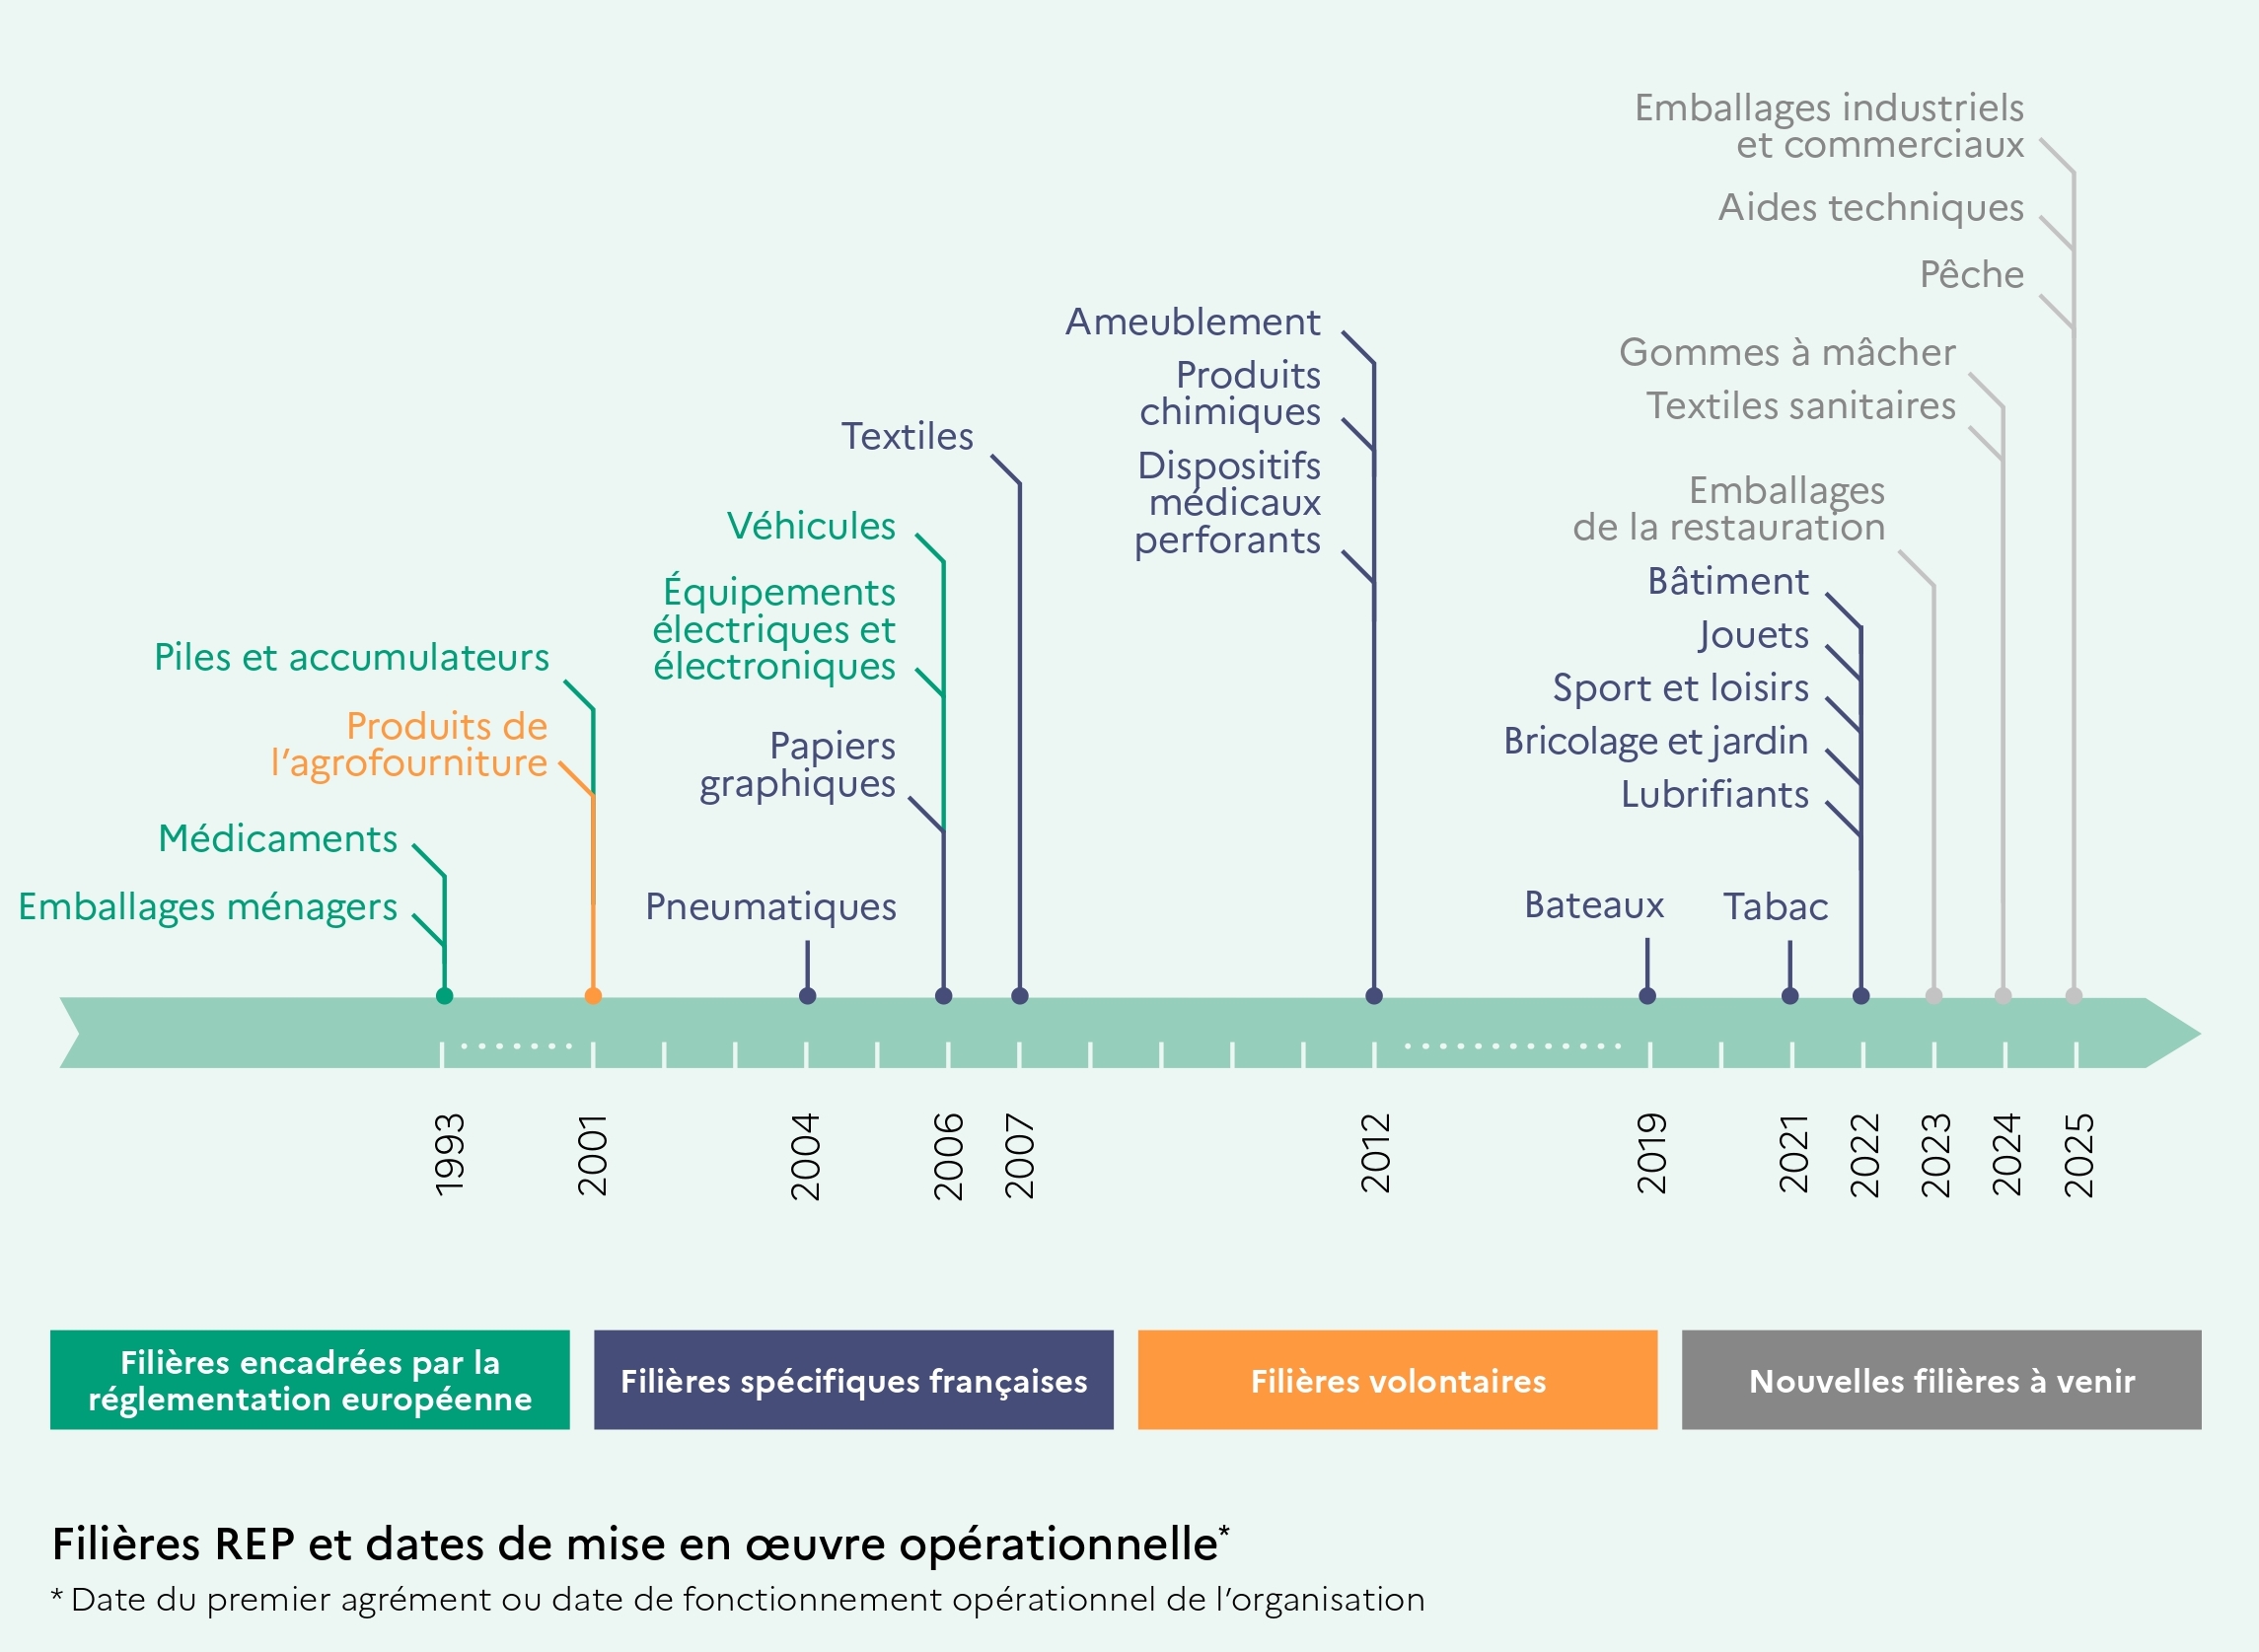
- Examples of waste recoveryRecovery contextWaste can be recovered using several techniques: recycling, electric or thermal energy production, reuse, etc. The French waste recovery and recycling industry comprises 1,600 companies with 19.3 billion euros in revenue in 2024, according to the Ministry of Economy.Energy recovery from waste through municipal solid waste incineration• Incineration is the primary method of energy production from waste. There are 116 municipal waste incineration facilities in France in 2022, of which 21% produce heat, 12% produce electricity, and 67% produce both heat and electricity, according to ADEME. • In 2023, 17.9 terawatt-hours were produced from waste treatment, equivalent to annual consumption for 8 million French residents. • In this production, 14.1 terawatt-hours come from municipal solid waste incineration units, 1.6 from non-hazardous waste storage facilities, and 2 from anaerobic digestion units. The produced energy is mainly recovered as heat: 9.7 terawatt-hours thermal and 4.3 terawatt-hours electrical. • Bottom ash is the primary residue from waste incineration. In 2016, incinerators produced 2.29 Mt which are directed to maturation platforms or recovery units. They are then used in mortar for roads and building foundations. The 0.4 Mt of flue gas cleaning residues are mostly sent to storage centers. • Biogas recovery from landfills also enables energy production, though in smaller quantities. For non-hazardous waste storage facilities, biogas recovery improves facility profitability. Electricity and heat production from landfill biogas reached 1.6 terawatt-hours in 2016. Between 2002 and 2016, this production quadrupled.Recycling household packaging and graphic paper• Household packaging has been subject to extended producer responsibility since 1993, and graphic paper since 2007. • Since January 1, 2024, these two systems merged into one: the household packaging and graphic paper stream. • The goal is to reduce household packaging quantities, develop reuse and recycling solutions for packaging, and support improved collection and sorting performance. • Through this stream, 5 Mt of waste is recycled in 2023, approximately 77% of household packaging and paper placed on the national market. • Household packaging recycling rates still vary greatly by material. It is 89% for paper-cardboard packaging, 81% for glass, 40% for wood, and only 25% for plastic. • Several measures have already been implemented to achieve recycling targets, such as generalizing sorting information, extending sorting guidelines to all plastic packaging, and the recent deployment of sorting bins in public spaces. • In 2023, the extension of sorting guidelines to many plastic packaging items affects 98% of the population. • Initial feedback from pilots confirms observed trends: selective plastic collection increases by approximately 2 kg per capita per year. A spillover effect increases collection volumes for other recyclable materials.Municipal waste treatment facilities• The "municipal solid waste treatment facilities" survey is conducted every 2 years by ADEME with facility operators for sorting, thermal and biological treatment, and non-hazardous waste storage. An ADEME survey tracks the evolution of tonnages and 1,700 treatment facilities. Waste anaerobic digestion is expanding, enabling both organic and energy recovery, as well as sorting centers, while landfills and incinerators decline. • To reduce waste landfilling in favor of recovery, the number of storage centers declined from 322 in 2004 to 205 in 2018. • Over the same period, the number of sorting centers increased from 324 in 2004 to 408 in 2018, and composting centers increased from 401 in 2004 to 657 in 2018. Additionally, incinerators and landfills were equipped for better energy recovery and modernized to limit atmospheric emissions.
Further reading
- La collecte des déchetsnotre-environnement.gouv.fr
En 2021, 41,3 millions de tonnes de déchets ménagers et assimilés ont été collectés par le service public de gestion des déchets, soit 6 % de plus qu’en 2019.
- SINOE Déchetssinoe.org
Développé en collaboration avec plusieurs utilisateurs, le site SINOE® déchets a été conçu pour répondre aux attentes et besoins du terrain. Son contenu riche, fiable et actualisé offre aux collectivités des informations essentielles sur les déchets ménagers. Au-delà de l’observation, SINOE® déchets est un outil d’analyses efficace qui apporte à chacun un éclairage sur la gestion des déchets ménagers pour orienter la décision.