This equation will change how you see the world (the logistic map)
what's the connection between a dripping faucet the Mandelbrot set a population of rabbits thermal convection in a fluid and the firing of neurons in your brain
6 chapitres
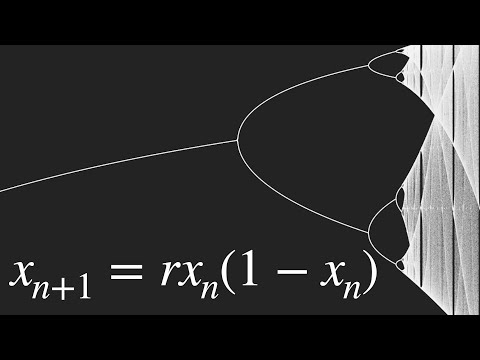
- Introduction to the Logistic MapProblem SetupA simple exponential population model where next year's population equals this year's population multiplied by a growth rate results in unlimited exponential growth, which is unrealistic.SolutionAdding a constraint term (1 - X) representing environmental limits creates the logistic map equation: xn+1 = R·xn·(1 - xn), where X is population as a percentage of maximum.Visual PatternGraphing population next year versus this year produces an inverted parabola, the simplest equation with a negative feedback loop.Example BehaviorWith R = 2.6 and starting population of 0.4, the population stabilizes at approximately 0.615 regardless of initial conditions.
- Equilibrium and BifurcationGrowth Rate Effects• Below R = 1: population goes extinct • R = 1 to 3: population stabilizes at a constant equilibrium value • Higher R values produce higher equilibrium populationsPeriod DoublingWhen R exceeds 3, the graph splits into two branches. Instead of a single equilibrium, populations oscillate between two values. As R increases further, bifurcations occur more frequently: populations cycle through 4 values, then 8, 16, 32, and so on.Chaos ThresholdAt R = 3.57, the system enters chaos where populations never settle into a repeating pattern, bouncing seemingly randomly. This chaotic behavior provided early methods for generating pseudo-random numbers on computers.Order ReturnsAs R increases beyond the chaotic region, windows of stable periodic behavior reappear amid the chaos, such as a stable 3-year cycle at R = 3.83.
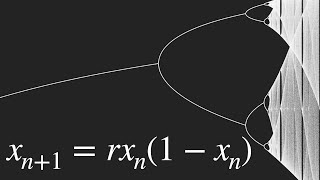
- The Bifurcation Diagram and FractalsDiagram StructurePlotting equilibrium population on the y-axis against growth rate R on the x-axis reveals a diagram showing the transition from stable equilibrium to period doubling to chaos.Fractal NatureThe bifurcation diagram exhibits fractal properties where large-scale features repeat on progressively smaller scales. Zooming in reveals self-similar patterns.Mandelbrot ConnectionThe bifurcation diagram is actually embedded within the Mandelbrot set. When viewing the Mandelbrot set from the side (with iteration values on the z-axis), the bifurcation diagram emerges from within it.Mandelbrot Regions• Main cardioid: numbers stabilize on a single constant value • Main bulb: oscillation between two values • Smaller bulbs: periods of 4, 8, 16, 32, with the chaotic needle containing stability windows
- Real-World ApplicationsFluid DynamicsPhysicist Lib Taber's mercury convection experiment confirmed period doubling. Increasing temperature gradient caused fluid cylinders to develop periodic temperature spikes that doubled their frequency progressively.Biological Systems• Salamander and human eye response to flickering lights exhibits period doubling at certain flicker rates • Rabbit heart studies showed period doubling route to chaos, with chaos theory used to apply electrical shocks and restore normal beatingEveryday PhenomenaDripping faucets demonstrate period doubling and chaos with adjustable water flow. Simple physical conditions produce complex chaotic behavior.Population ScienceThe logistic map successfully models animal populations in controlled laboratory environments, particularly validated in ecological studies.
- The Feigenbaum Constant and UniversalityDiscoveryPhysicist Mitchell Feigenbaum discovered that the ratio between successive bifurcation widths converges to approximately 4.669, now called the Feigenbaum constant.MysteryThis constant appears to be a fundamental constant of nature with no known relation to other physical constants. Its origin remains unexplained.Universal PrincipleThe Feigenbaum constant applies to any equation with a single hump when iterated. For example, xn+1 = sin(xn) exhibits the same bifurcation ratio of 4.669.Broader SignificanceThe discovery reveals universality in chaos theory: fundamental properties emerge across different physical systems and mathematical equations, suggesting deep universal principles in nature.
- Educational Impact and ConclusionRobert May's LegacyBiologist Robert May's 1976 Nature paper sparked a revolution in chaos research, calling for teaching students about the logistic map to build intuition about how simple equations create complex behavior.Current GapDespite May's plea, educational systems still focus on simple equations with simple outcomes. Teaching chaos theory could dramatically change how students understand mathematical and physical systems.Personal MotivationThe speaker was inspired by James Gleick's book Chaos and has long wanted to create educational content on this topic, finding the equation and Feigenbaum constant extraordinarily fascinating.Broader TakeawayThe logistic map demonstrates that fundamental understanding of the world requires appreciating how simple mathematical principles underlie complex, chaotic phenomena across biology, physics, and engineering.